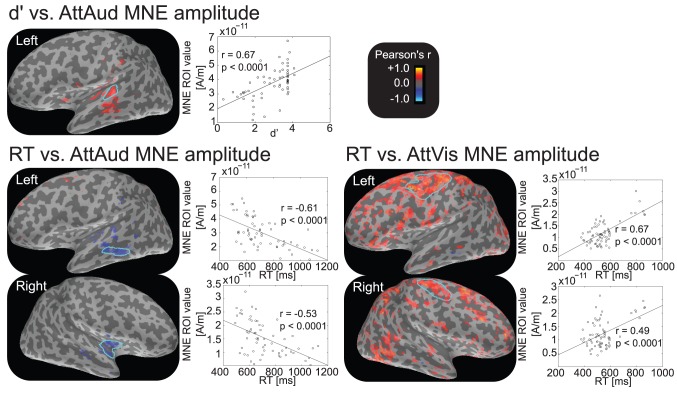
Figure 9. Correlations between behavioral data and MNE activity.
The correlations were calculated for each vertex at the M100 peak latency for the per-subject data. The correlations shown on the overlaid cortex are thresholded at  . Scatterplots show the mean amplitude of the selected ROI vs. the behavioral measure (across subjects and stimuli). The detectability index
  correlated with the vertices showing high M100 amplitude. Reaction time (RT) had a negative correlation in both hemispheres during AttAud condition, whereas significant RT correlations during AttVis condition were probably at least partly artificial due to uneven distribution of data.

