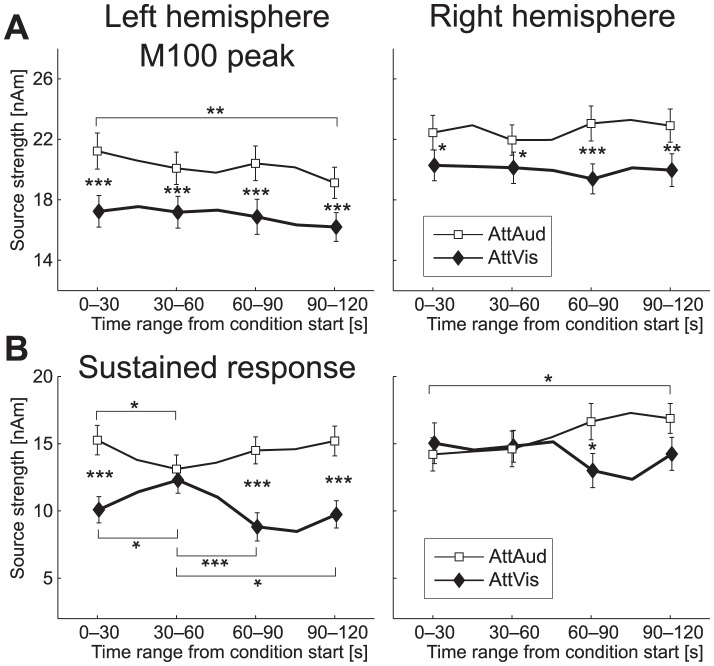
Figure 10. Time course of the attention effect.
(A) M100 and (B) sustained response amplitudes ( SEM) as a function of time from condition start, averaged across maskers for clarity. The M100 attention effect does not show any dynamics, but the sustained response shows a significant interaction effect with attention and time range from the condition start. Significant differences between AttAud and AttVis are indicated by asterisks between the curves, and significant differences within condition between time ranges are marked either above or below the curves (for AttAud and AttVis, respectively, *
  , **
, **  , ***
, ***  ).
).

