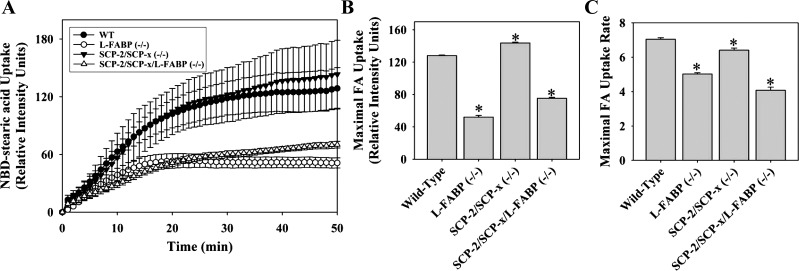
Fig. 4.
Alterations in uptake of cellular NBD-stearic acid uptake due to loss of SCP-2 and/or L-FABP. A: time-course analysis of relative cellular fluorescence in WT, L-FABP null, SCP-2/SCP-x null, and SCP-2/SCP-x/L-FABP null hepatocytes after addition of 0.01 μM NBD-stearic acid. Uptake curves were fit using the Wiebull equation. B and C: maximal cellular fluorescence intensity and maximal uptake rate. Values are means ± SE; n = 10–15 cells. *P < 0.05 vs. WT.

