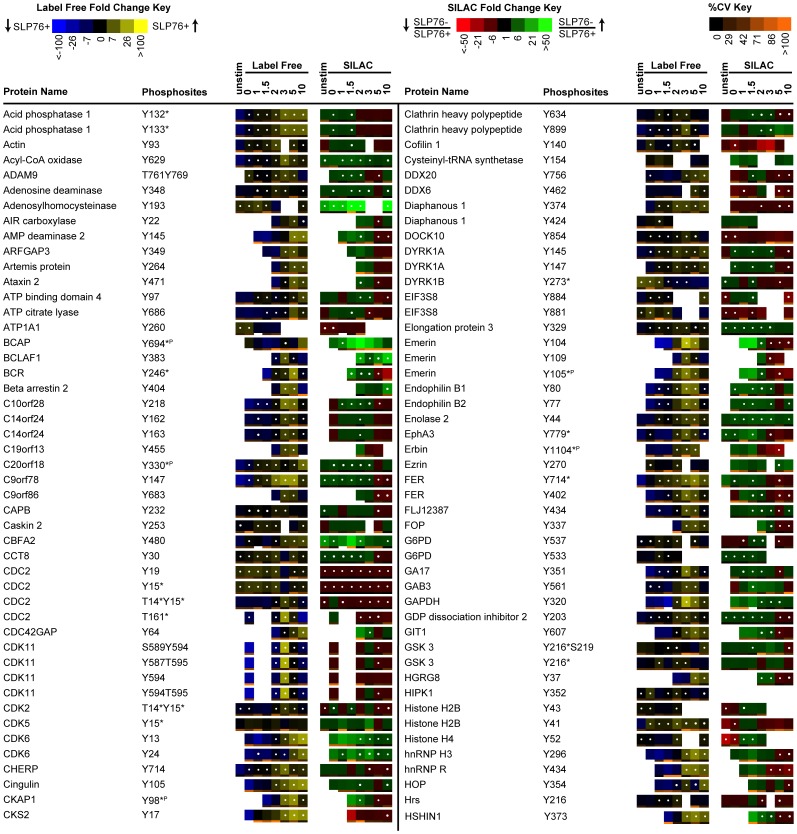
Figure 4. Quantitative phosphoproteomic analysis of proteins not previously known to be associated with TCR signaling.
Listed above is a portion of the data collected, representing proteins not previously established to be involved in TCR signaling. Temporal changes in phosphorylation abundance are represented as heatmaps from 3 replicate experiments as described in methods. The label free heatmap represents the change of abundance of phosphopeptides in SLP-76 reconstituted cells across 10 minutes of TCR stimulation while the SILAC heatmap represents the ratios of abundance of phosphopeptides in SLP-76 deficient cells relative to SLP-76 reconstituted cells at each of the TCR stimulation timepoints. The label free and SILAC heatmaps are described in detail as in Figure 3.

