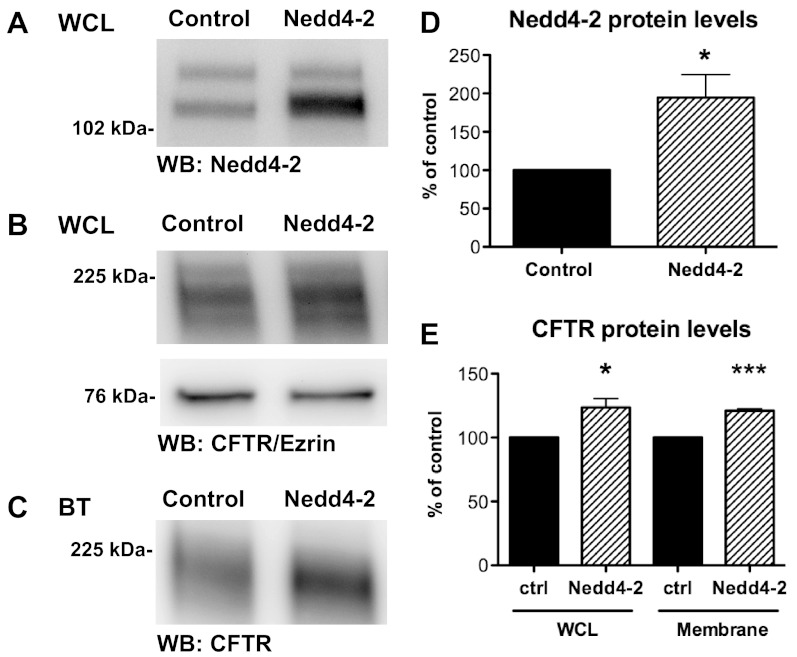
Fig. 7.
Biotinylation experiments in CFBE-wt cells transfected with control vector or Nedd4–2. Representative Western blots of Nedd4–2 (A) and wt-CFTR and Ezrin in WCL (B). Plasma membrane wt-CFTR as determined by membrane biotinylation (C). D: summary of Nedd4–2 levels in control (vector) and Nedd4–2 overexpressing cells (N = 6). E: summary of WCL and membrane wt-CFTR for control and Nedd4–2 overexpressing cells (N = 6). *P < 0.05, ***P < 0.001.

