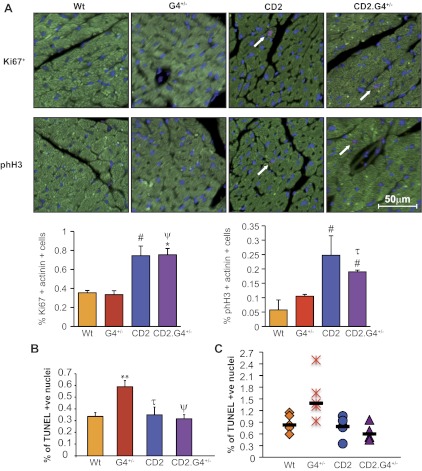
Fig. 6.
Analysis of cardiomyocyte proliferation and survival. A, top: immunofluorescent analysis of Ki67 and phH3 expression on adult heart sections. Green is actinin staining to mark cardiomyocytes, red is for Ki67 or phH3 staining as indicated, and blue marks nuclei (4,6-diamidino-2-phenylindole). White arrows indicate positive nuclei. A, bottom: percentage of Ki67/actinin and phH3/actinin-positive nuclei vs. WT. Note the significant increase in the level of proliferation in the CD2 and CD2.G4+/− mice. The results presented are means ± SE (n = 4 for each mouse group). B: quantification of terminal transferase-mediated dUTP nick end labeling (TUNEL) assays on adult heart sections (170 days) showing the percentage of TUNEL-positive (+ve) nuclei. Ten regions from each heart section were counted. The results shown are means ± SE (n = 3 for each group). Note the statistically significant increase in the percentage of apoptotic nuclei in the G4+/− mice, which was completely restored back to WT level in the CD2/G4+/− mice. C: scatter plot showing the percentage of TUNEL-positive cardiomyocytes in heart sections from adult (180 days) doxorubicin-treated mice. Sixteen regions from each heart section were taken (n = 4–7 for each group). #P < 0.05 vs. WT; **P < 0.01 vs. WT; τP < 0.05 vs. G4+/−; ψP < 0.005 vs. G4+/−.

