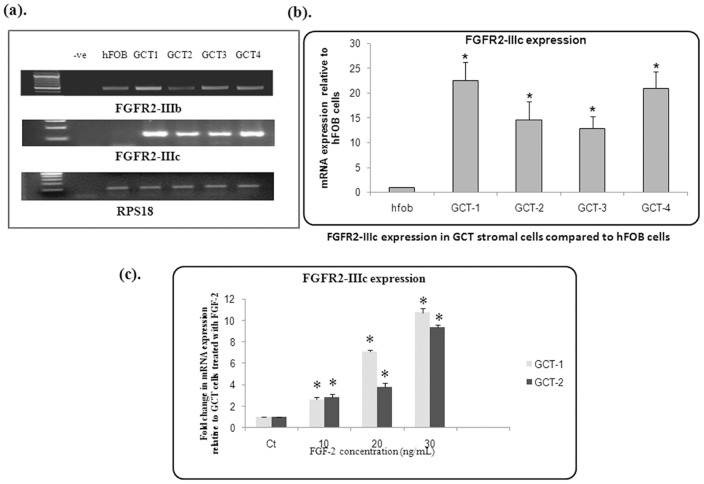
Figure 1. Semi-quantitative PCR.
(a). Endogenous expression of FGFR2-IIIb and FGFR-2IIIc in GCT stromal cells using FGFR2 specific primers. (b). Real-time PCR of cDNA from GCT stromal cell lysates showing expression of FGFR2-IIIc relative to hFOB 1.19 cells (“hFOB”). Results are the average of three replicate experiments. (c). An increase in expression of FGFR-2IIIc is in response to FGF-2 ligand in GCT stromal cell in a dose dependent manner. Results are the average of three replicate experiments.

