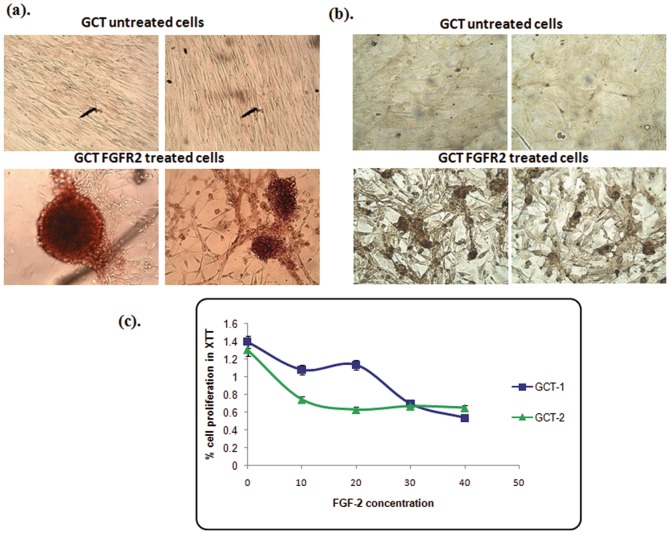
Figure 2. Bone nodule forming assay.
(a). GCT stromal cells were induced into osteoblastic differentiation by exposure to FGF-2. Alizarin staining was used for bone nodules, and visualized by phase-contrast microscopy. (b). Von Kossa staining were used to determined GCT stromal cells osteoblastic differentiation by exposure to FGF-2. Bone nodules are visualized by phase-contrast microscopy. (c). XTT assay. A decreased number of mitochondrial active cells were seen in FGF-2 treated cells when compared to untreated GCT stromal cells. GCT untreated cells were used as a control (CT).

