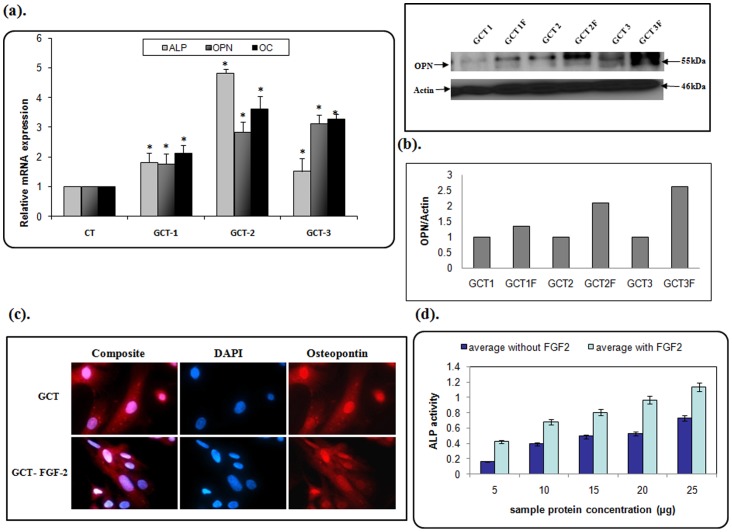
Figure 3. FGF-2 promotes osteogenic differentiation in GCT cells.
(a). qRT-PCR analysis representing an increase in osteogenic differentiating markers ALP, OPN, and OC (p<0.05). These results are verified at the protein level by Western blot analysis. (b). Quatification analysis showing an increasing OPN protein level in all FGF2 treated cell types when compared to untreated cells. (c). Subcellular localization of OPN in GCT stromal cells was detected by immunofluorescence using an anti-OPN monoclonal antibody. DAPI (blue) staining indicated the nuclei. F = FGF-2 treated cells. (d). GCT cells were incubated with and without FGF-2 (20 ng/mL) for 48 h. The cells were then analyzed for ALP activity. Data represent mean ±SD. *p<0.05.

