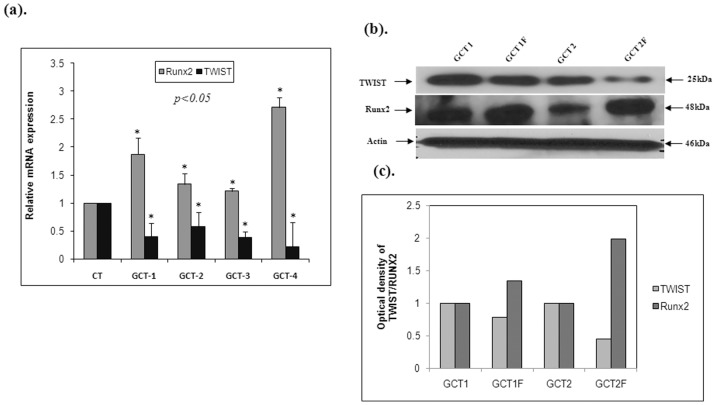
Figure 4. FGF-2 stimulation effects on osteoblastic transcription factors in GCT cells.
Quantitative RT-PCR, Western blot and quantification analysis representing a significant decrease in TWIST1 and a significant increase in Runx2 mRNA and protein levels in GCT cells treated with FGF-2 (GCT1F, and GCT2F,) when compared to the GCT untreated (GCT1, and GCT2) FGF-2 cells.

