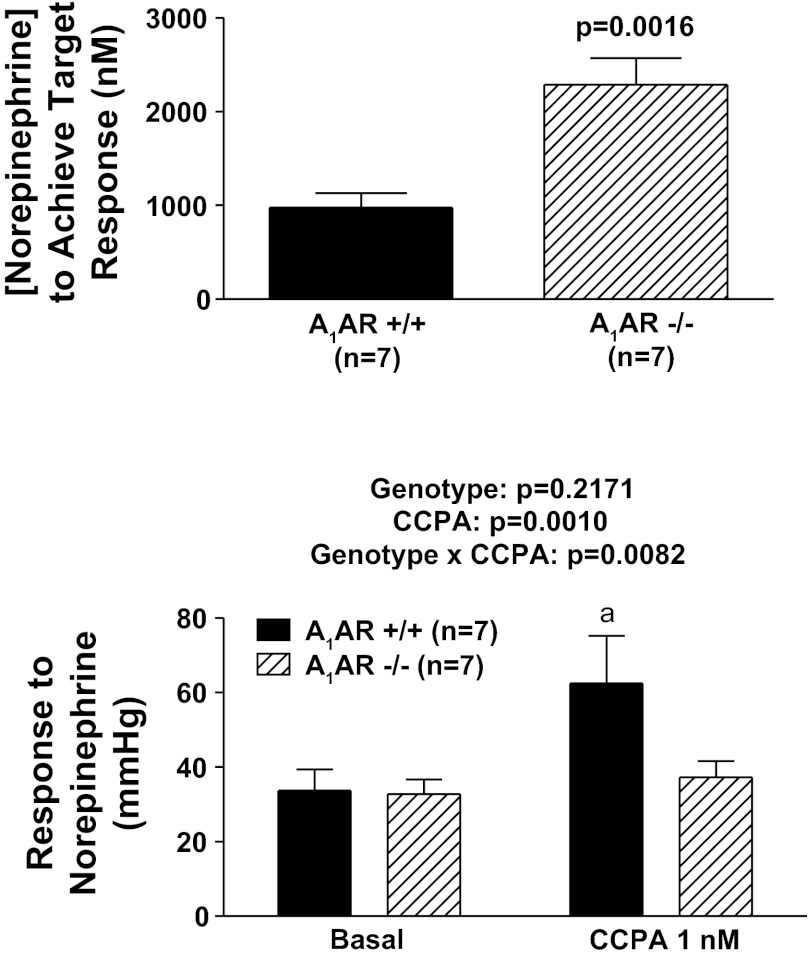
Fig. 5.
Top: bar graph compares concentration of NE necessary to achieve a target response (change in perfusion pressure of ∼30 mmHg) in A1AR−/− vs. A1AR+/+ kidneys. P value is for unpaired Student's t-test. Bottom: bar graph illustrates effects of CCPA (highly selective A1 receptor agonist) on renovascular responses (changes in perfusion pressure) to exogenous NE in A1AR−/− vs. A1AR+/+ kidneys. P values in panel are from nested 2-factor ANOVA comparing the 2 different genotypes; aP < 0.05 compared with corresponding basal value (Fisher's LSD test). All values represent means ± SE.

