Fig. 2.
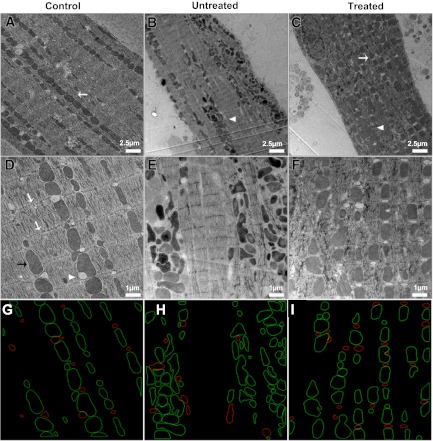
Ultrastructural analysis of cardiac myocytes. A–F: transmission electron micrographs of isolated cardiac myocytes from control rats (A and D), untreated diabetic UCD-T2DM rats (B and E), and diabetic rats treated with soluble epoxide hydrolase inhibitor (C and F). Scale bars = 2.5 μm in A–C and 1.0 μm in D–F. White arrows in A and C indicate long, single tracks of mitochondria. White arrowheads in B and C indicate short, agglomerated mitochondria tracks. White arrows in D indicate the Z-lines for adjacent sarcomeres of a myofibril. The black arrow in D points to a single mitochondrion, and the white arrowhead indicates a fat deposit. G–I: contours for mitochondria (green) and fat vacuoles (red) in the images from D–F.

