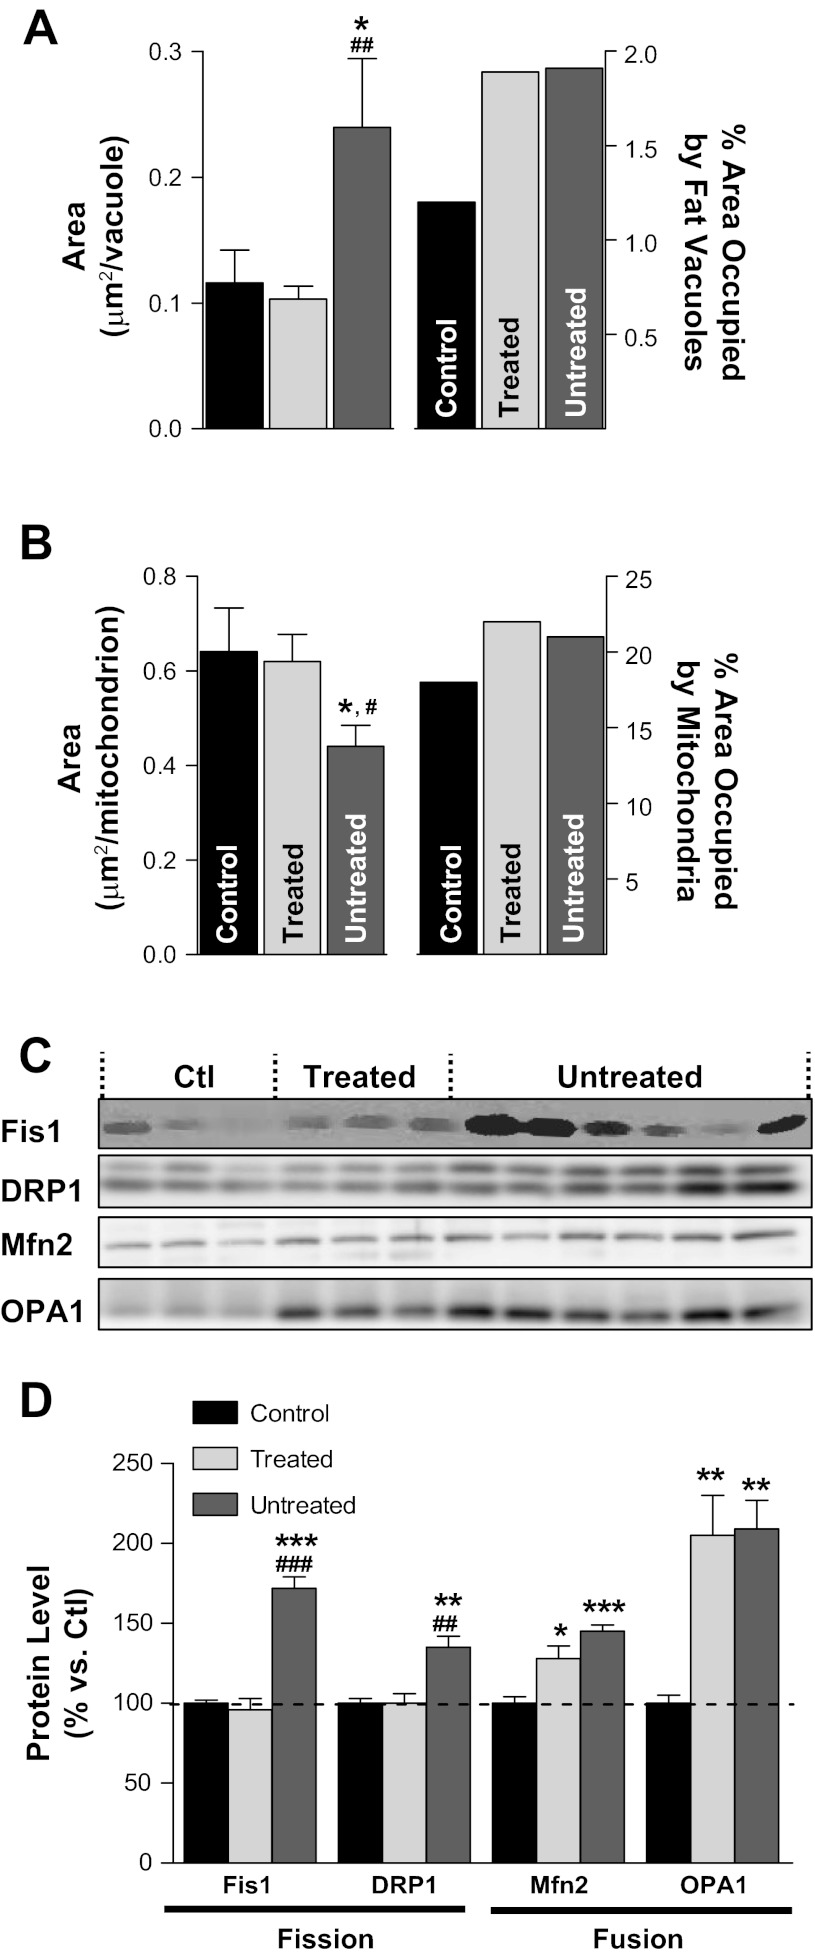
Fig. 3.
Larger fat vacuoles and mitochondrial fragmentation in myocytes from untreated UCD-T2DM rats. A: average surface area of individual fat vacuoles (left) and the percent area they occupy (right) in myocytes from control (Ctrl), treated, and untreated rats. B: average surface area of individual mitochondria (left) and surface area occupied by mitochondria (as a percentage of myocyte area; right). Data in A and B were calculated from the transmission electron microscopy images. C and D: expression levels of proteins associated with mitochondrial fission [fission protein 1 (Fis1) and dynamin-related protein 1 (DRP1)] and fusion [mitofusin 2 (Mfn2) and optic atrophy 1 (OPA1)]. *P < 0.05 vs. the control group; **P < 0.01 vs. the control group; ***P < 0.001 vs. the control group; #P < 0.05 vs. the treated group; ##P < 0.01 vs. the treated group; ###P < 0.001 vs. the treated group.

