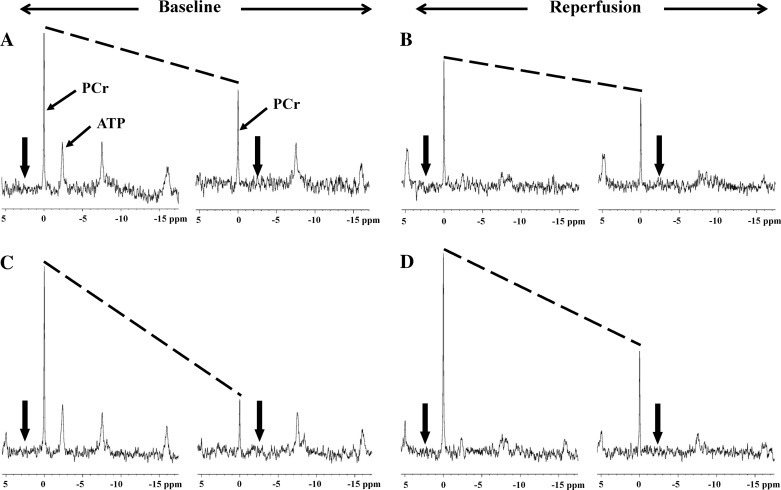
Fig. 3.
Representative 31P-magnetization transfer (MT) spectra from control (A, baseline; B, reflow) and CKM (C, baseline; D, reflow) hearts. The spectra were acquired with saturating irradiation (thick arrows) in the control position (left spectrum in each panel) and γ-ATP position (right spectrum in each panel). The decrease in the height of PCr peak between control and γ-ATP saturation (slope of the dotted lines) is directly related to the rate of ATP synthesis through the CK reaction. A greater decline in PCr signal with γ-ATP saturation observed in CKM vs. control hearts (both at baseline and during reperfusion) indicates higher ATP flux through CK in CKM hearts.

