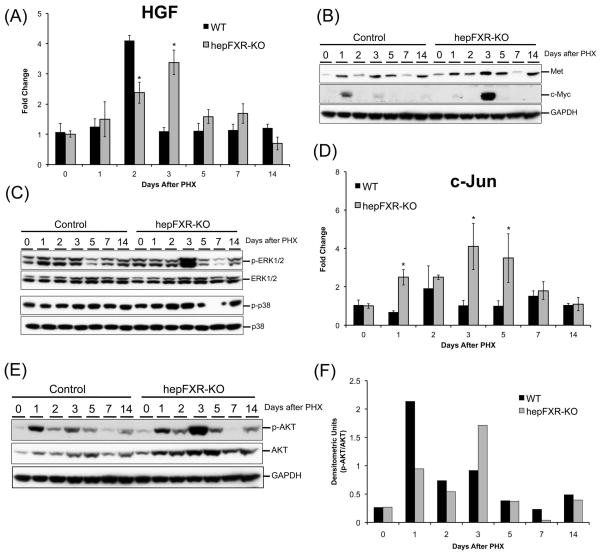
Figure 4.
Delayed signaling via HGF signaling axis in hepFXR-KO mice after PHX. (A) Real Time PCR analysis of HGF in Control and hepFXR-KO livers after PHX. The different degrees of significance was indicated as follows in the graphs- *P<0.05; **P<0.01; ***P<0.001. Western blot analysis of Met and c-Myc (B), ERK-1/2, phosphorylated ERK1/2, p38 and phosphorylated p38 (C) using RIPA extract of Control and hepFXR-KO livers obtained at various time points after PHX. (D) Real time PCR analysis of c-Jun mRNA in Control and hepFXR-KO mice after PHX. The different degrees of significance was indicated as follows in the graphs- *P<0.05; **P<0.01; ***P<0.001. (E) Western blot analysis of total and phosphorylated AKT using RIPA extract of Control and hepFXR-KO livers obtained at various time points after PHX. The ratio of total and phospho-AKT is shown in the bar graph in (F).

