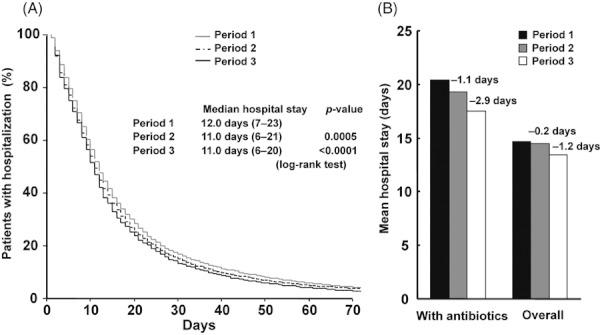
Figure 5.

Kaplan–Meier plot for the length of hospital stay who received intravenous antibiotics (A) and comparison of the duration of hospital stay in patients with intervention and in overall patients (B) before and after intervention. The number of patients receiving intravenous antibiotics was 6251, 6348 and 6507 before, initial and active intervention period, respectively, while the number of overall patients was 11,582, 11,570 and 12,321 in each intervention period, respectively. The intervention significantly shortened the duration of hospital stay (log-rank test). Solid line: active intervention period (period 3), dashed line: initial intervention period (period 2), grey line: before intervention period (period 1)
