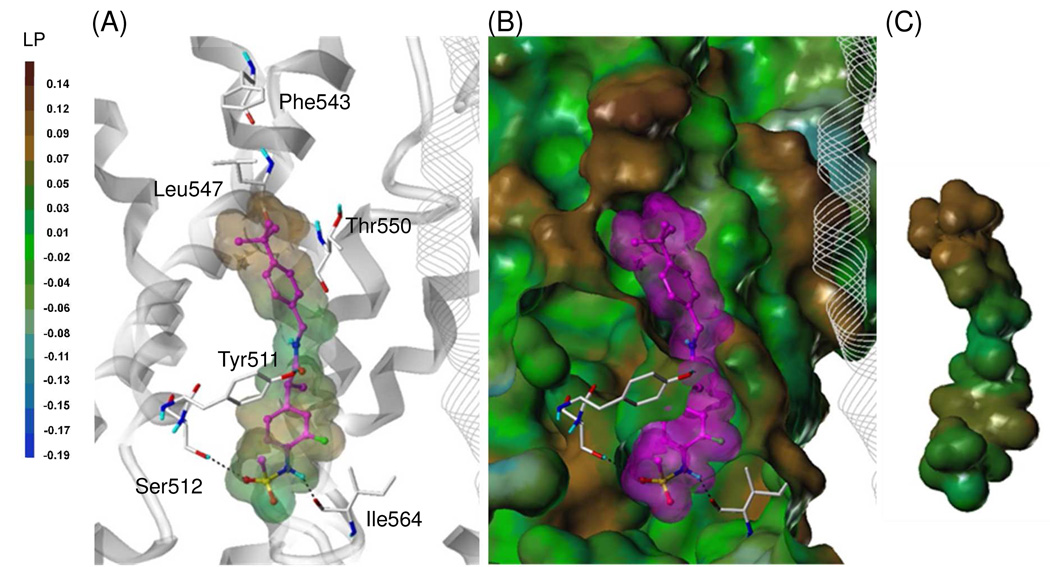
Figure 5.
Flexible docking of 2 in the hTRPV1 model.
(A) Binding mode of 2. The key residues are marked and displayed as capped-stick with carbon atoms in white. The helices are colored in gray and the helices of the adjacent monomer are displayed in line ribbon. The ligand is depicted as ball-and-stick with carbon atoms in magenta. The van der Waals surface of the ligand is presented with its lipophilic potential property. Hydrogen bonds are shown as black dashed lines and non-polor hydrogens are undisplayed for clarity. (B) Surface representations of the docked ligand and hTRPV1. The Fast Connolly surface of hTRPV1 was generated by MOLCAD and colored by the lipophilic potential property. The surface of hTRPV1 is Z-clipped and that of the ligand is in its carbon color for clarity. (C) Van dar Waals surface of the ligand colored by its lipophilic potential property.

