
Figure 1. Differential Gene Expression and Methylation Correlation.
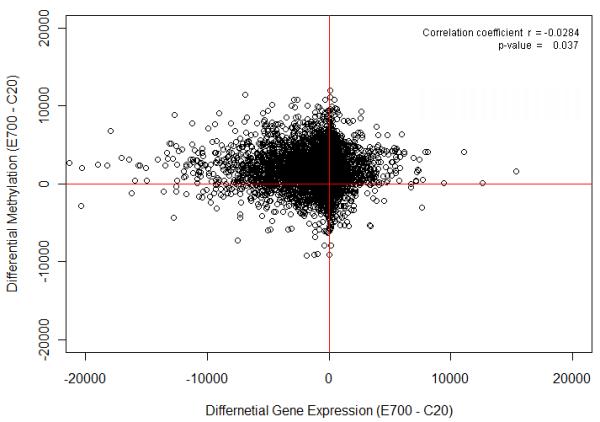
A scatter plot of differential gene expression of control PND20 and developmentally-exposed PND700 (E700 - C20) vs the differential methylation of control PND20 and developmentally-exposed PND700 (E700 - C20). Methylation signal intensity data were linearly transformed.