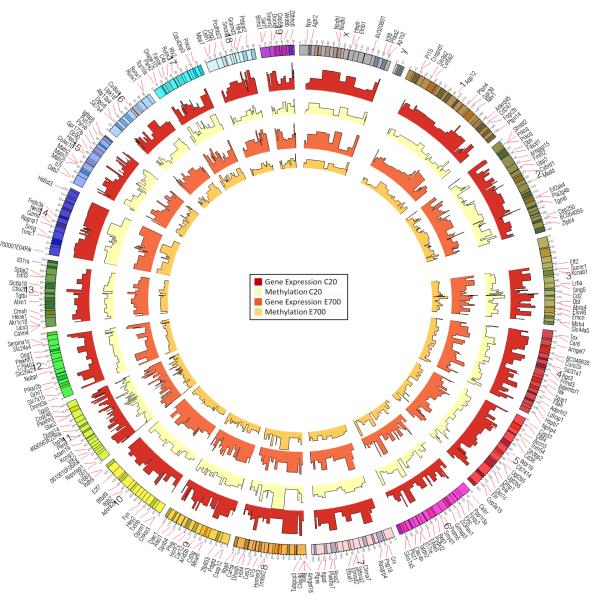
Figure 2. Gene Expression and Methylation Profile.
A circular representation of the genes with ≥2 fold change (563 genes) in gene expression of control PND20 and developmentally-exposed PND700. The tracks from the outside represent: (1) Genes, (2) Chromosomes, (3) Gene Expression of Control PND20, (4) Methylation of Control PND20, (5) Gene Expression of developmentally-exposedPND700, (6) Methylation of developmentally-exposed PND700.

