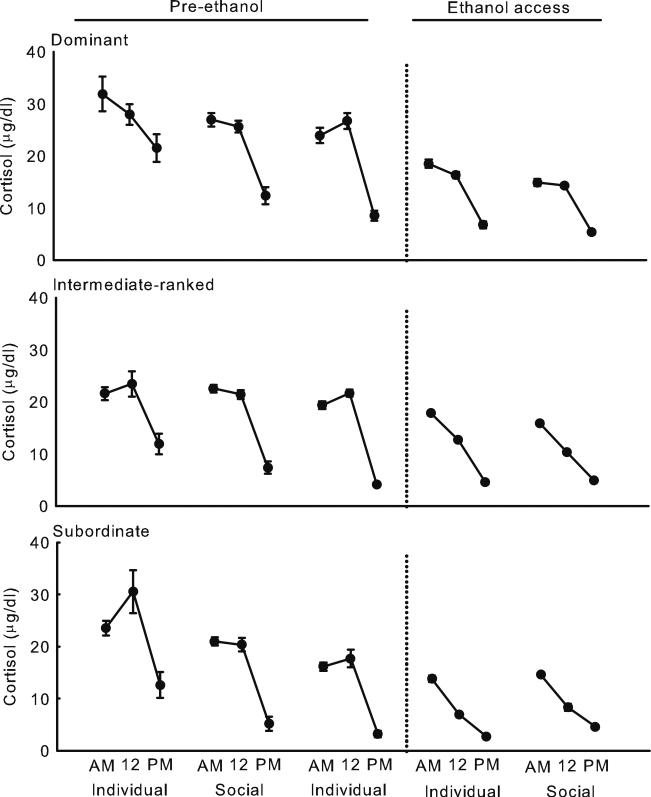
Fig. 2.
Mean ± SEM cortisol at 7:00 (AM), noon (12), and 5:30 (PM) during manipulations of housing before and after access to ethanol among dominant (top), intermediate-ranked (middle), and subordinate (bottom) monkeys. Error bars are near the symbols during ethanol access due to low variance in cortisol. Means are computed from 188 to 278 samples per monkey

