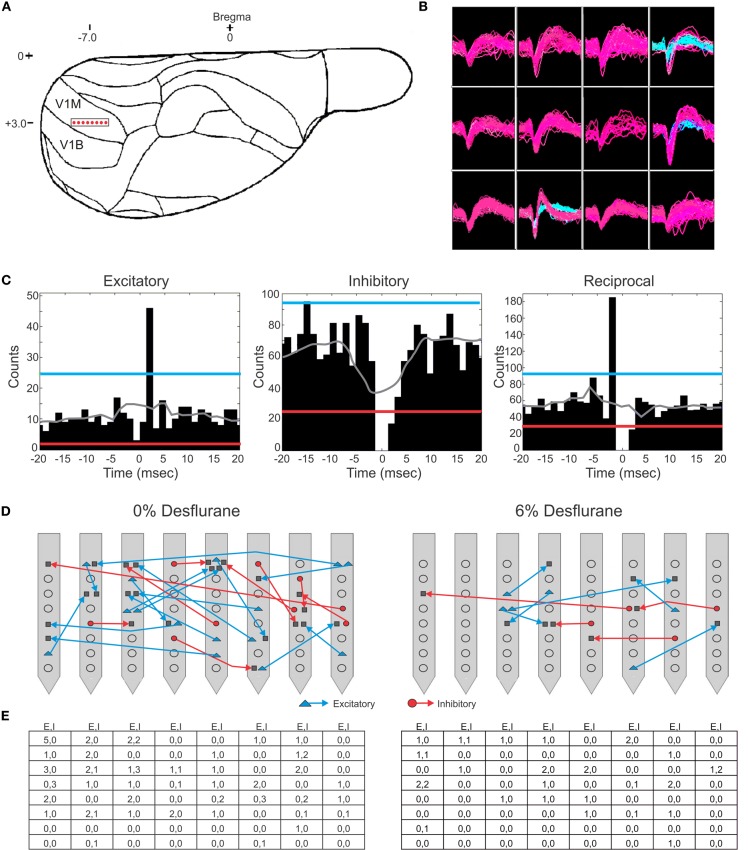
Figure 1.
Schematic of electrode placement and examples of recorded units and connection types. (A) Electrode placement of the 64-contact neural probe in the rat primary visual cortex monocular region (V1M) in the right hemisphere. Each dot represents the approximate location of an electrode shank. Schematic is overlaid on a stereotaxic drawing obtained from the Paxinos rat brain atlas. (B) Example of recorded spike waveforms from 12 channels in one experiment. Color waveforms represent online sorting of units during acquisition. (C) Spike cross-correlograms for excitatory, inhibitory and reciprocal connections. Thresholds are represented for excitatory connections (blue line), inhibitory connections (red line), and jittered mean displayed as gray trace. Bin size is 1.3 ms. The gap in the center bin reflects the blanking period of spike sampling for connections observed within the same electrode contact. (D) Illustration of excitatory (blue) and inhibitory (red) connections superimposed on a map of electrode contacts during wakefulness (0% desflurane) and unconsciousness (6% desflurane) from all experiments. Presynaptic cell putatively defined as pyramidal cell (blue triangle), interneurons (red circle), or unclassified (gray square). In some cases multiple units are shown at the same contact. For greater clarity, connections between electrode contacts only are shown. (E) Number of classified within-contact excitatory and inhibitory (E,I) connections during wakefulness (left) and unconsciousness (right).

