Figure 2.
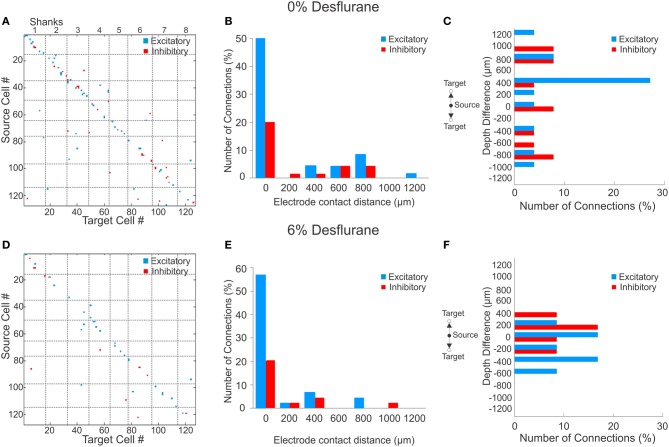
Excitatory and inhibitory connections at wakefulness and under anesthesia. (A) Matrix of observed excitatory and inhibitory connections for all rats combined at wakefulness arranged by order of mapping. Cells were numbered from 1 to 127 based on their position of their electrode contact within the array, and arbitrarily within electrode contacts, with the result that consecutive numbers are mapped to neighboring cells. Points on the diagonal represent within-electrode connections, points near the diagonal represent within-shank connections, and points far off the diagonal represent between-shank connections. Most excitatory (blue) and inhibitory (red) connections are found along the diagonal representing connections within or near the same contact. (B) Distribution of distance between source and target units during wakefulness. The number of connections in each bin is normalized to the total number of observed connections (excitatory + inhibitory). Most excitatory and inhibitory connections are found within the same electrode contact (73 and 64%, respectively). (C) Distribution of depth (source depth—target depth) of excitatory and inhibitory connections from different electrode contacts at wakefulness, corrected for angle of insertion. Excitatory connections project to superficial layers. (D) Connection matrix during unconsciousness. (E) Distance distribution of functionally connected neuron pairs at unconsciousness normalized to total number of connections. Similar to the wakeful condition, both excitatory and inhibitory connections are mainly found within the same electrode contact (81 and 69%, respectively). (F) During unconsciousness the connection depth was limited to shorter distances.

