
Figure 4.
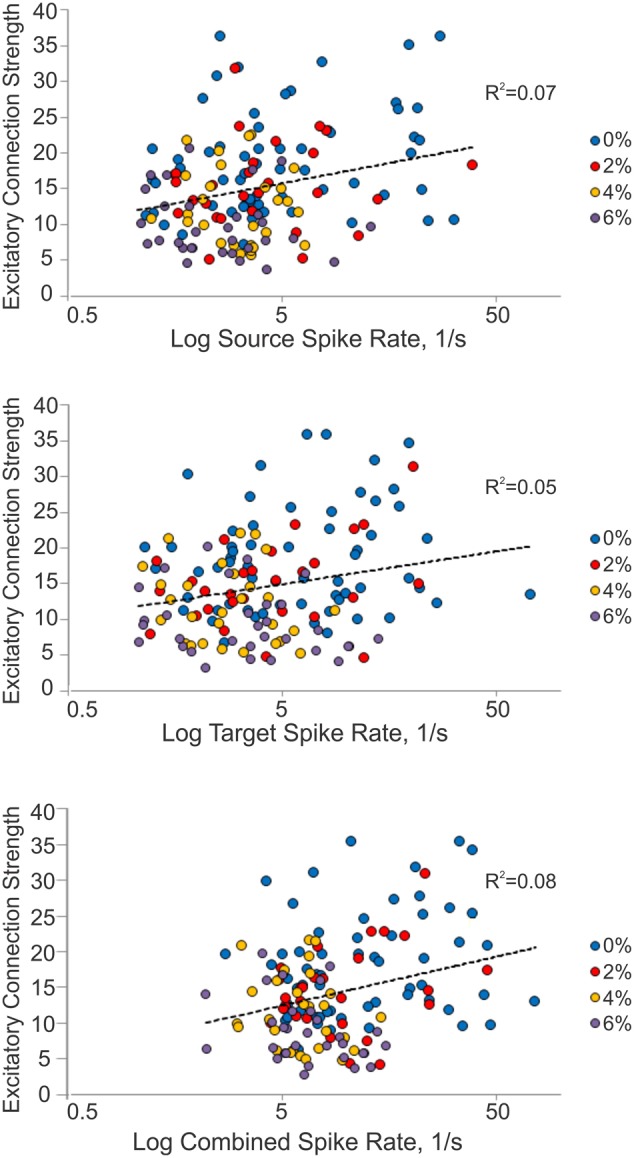
Relationship between connection strength and spike rate. Scatterplot of excitatory connection strength and source (top), target (middle) and combined (bottom) spike rates from all experiments. Source spike rate (R2 = 0.07), target spike rate (R2 = 0.05), or combined spike rate (R2 = 0.08) is not an indicator of connection strength.