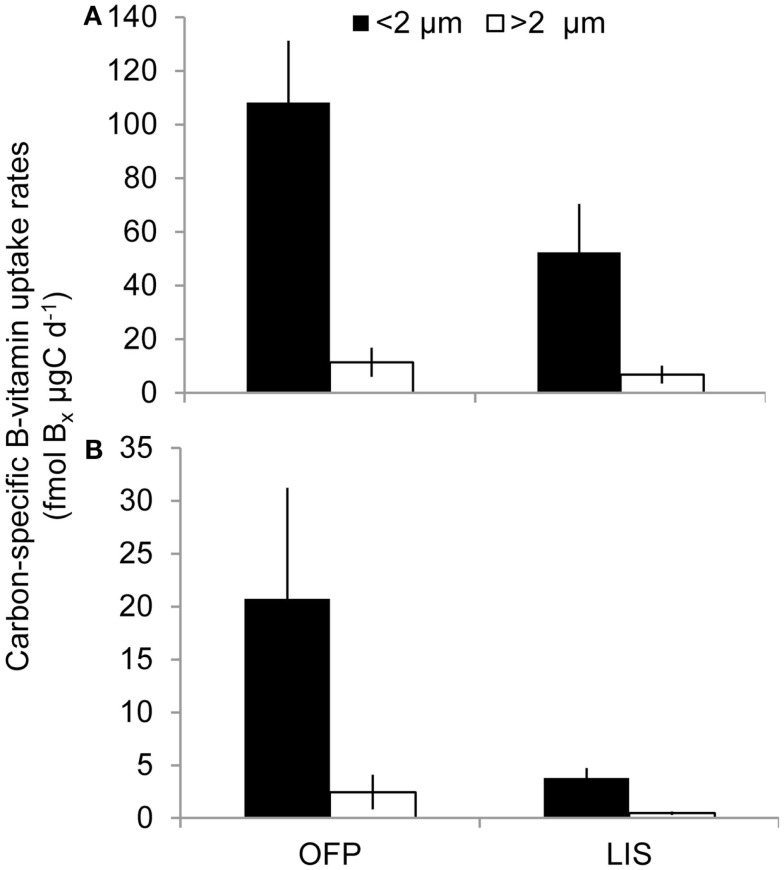
Figure 7.
Average B1 (A) and B12 (B) uptake rates normalized to particulate organic carbon (see Materials and Methods) for each size class and location over the course of the study. Values are shown as fmol of Bx μg C−1 day−1, where Bx stands for the corresponding B-vitamin.

