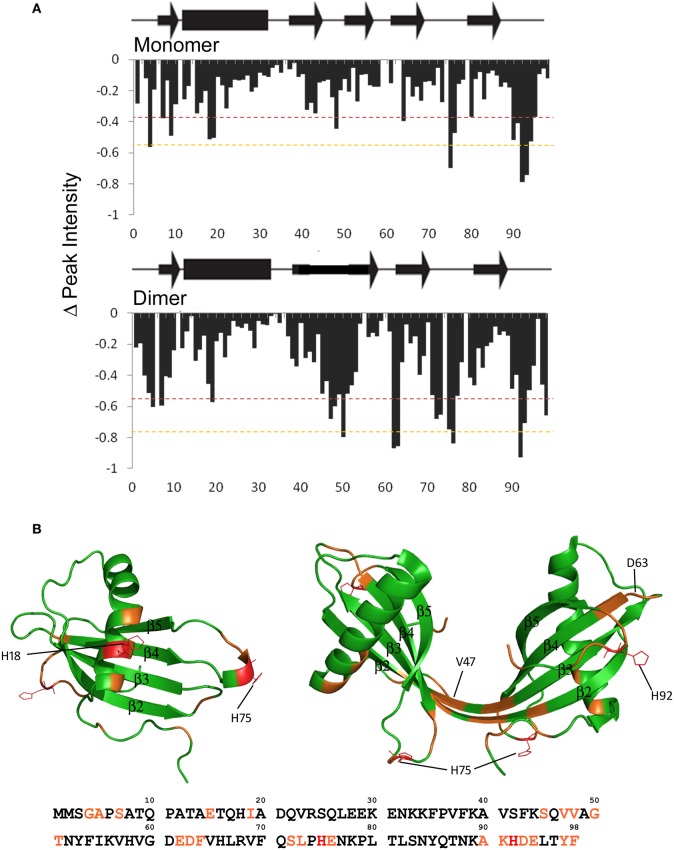
Figure 4.
Mapping copper binding sites in soluble stefin B. (A) Changes in the relative intensity of amide NMR signals upon Cu2+ binding (calculated from the 2D 1H15N HSQC spectra). The dashed lines represent one (red) and two (orange) standard deviations from average intensity changes measured in solution. Changes above standard deviation are deemed to be significant. (B) Residues with significant changes are plotted in orange on the structures of the stefin B monomer and dimer. Histidine residues that are within these regions are drawn in red and are shown in stick form to highlight their position.

