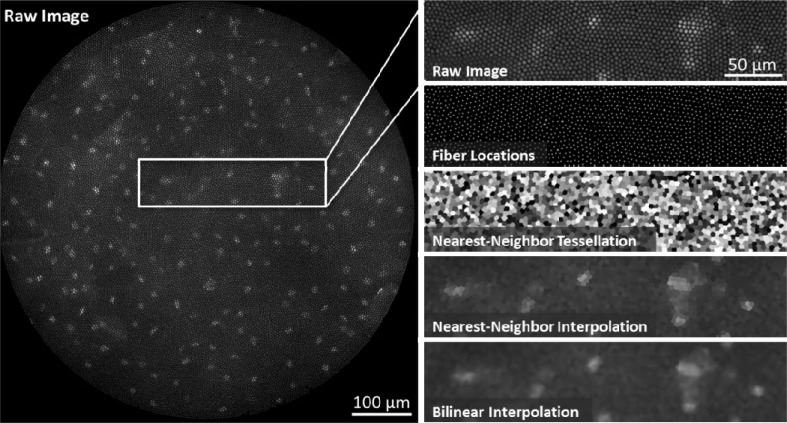
Fig. 2.
Fiber pattern removal. Left, the raw HRME image shows squamous epithelial cells in the oral cavity. Nuclei are labeled with the 0.01% Proflavine. The intensity information from the sample is “pixelated” by the 30,000-element fiber bundle. Right, the fiber pixelation pattern is removed using two-dimensional interpolation. First, the fiber center locations are identified using a regional maxima function. A Voronoi tessellation is then constructed from these points in order to determine the nearest-neighbor fiber pixel for every non-fiber pixel. A lookup table is determined from this tessellation and is used to reconstruct fiber-less HRME images in real-time. Other interpolation methods, such as bilinear interpolation, can be used but have longer computation times.

