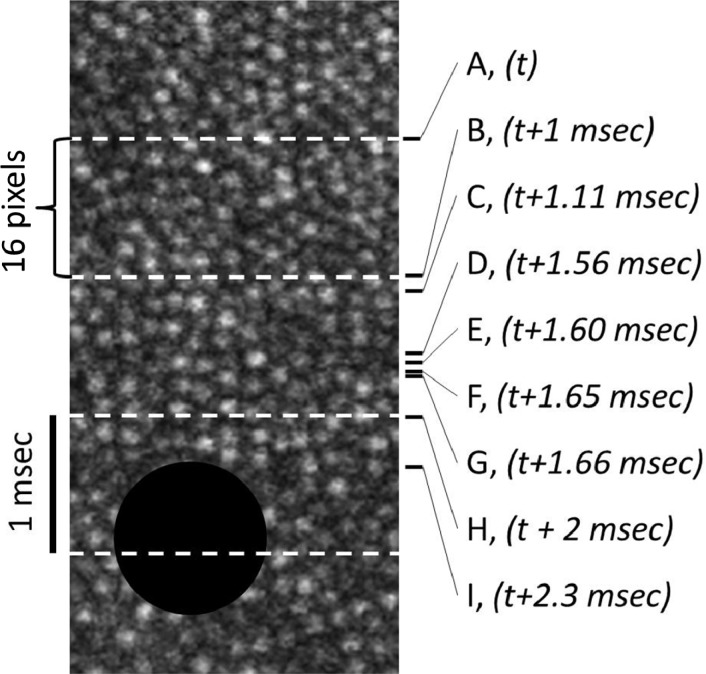
Fig. 5.
Timelines for targeted stimulus delivery. The figure shows a cropped region of an SLO frame split into 16 pixel segments as indicated by the dashed white lines. With a 16 kHz line rate, each 16 pixel segment takes 1 msec to complete as indicated on the right side of the figure. The right indicators show time points for the critical tasks involved in delivering a stimulus, in this case a black circle, to a targeted location. A, Center location of the 32-pixel image strip where position estimate is to be made. B, The final line in the current 32-pixel image strip is scanned and the complete strip is recorded into the FPGA memory. C, The image strip is read into the PC/GPU. D, The eye position at time t relative to the reference frame is estimated by the GPU. E, The time from t to the first line of the buffer that contains the estimated position of the stimulus is computed. F, Make decision: Is there enough time to wait for the next strip before arming the AOM buffer with the stimulus? If YES, then wait for next strip and repeat process. If NO, then proceed to step G. G, Load AOM buffer so it is armed to play out the stimulus while the beam scans over the target. H, Start playing out the AOM buffer at this strip. I, Start delivering the stimulus (note: when the stimulus is greater than 64 pixels in size, steps B to I are repeated for every strip that the stimulus occupies).

