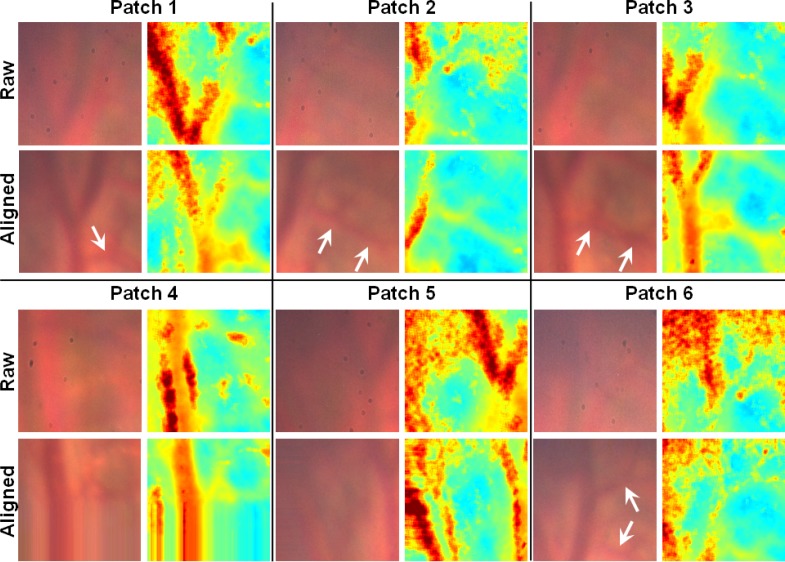
Fig. 6.
Colour images of selected patches of intestinal tissue reconstructed from the multispectral stack of images, and corresponding maps of total haemoglobin. Arrows indicate smaller blood vessels that are washed out in the raw images but become visible after alignment. The smear effect on Patch 4 and 5 is due to pixel padding after the region of interest around those features moved outside the boundary of the raw multispectral image.

