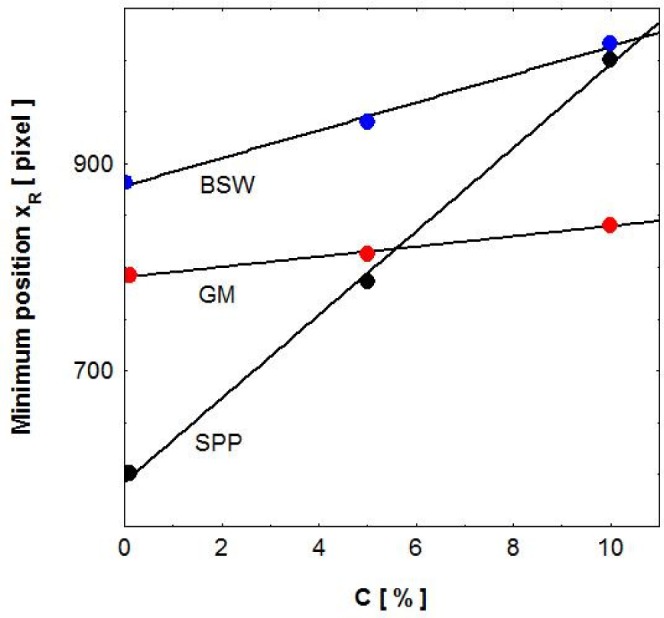
Fig. 2.

Positions of the resonances as a function of the glucose concentration in solutions, for both 1DPC (BSW and GM) and SPP based biochips on cover slips. The errors are smaller than the dimension of the symbols. Each point is the result of a 15 min long measurement.
