Fig. 5.
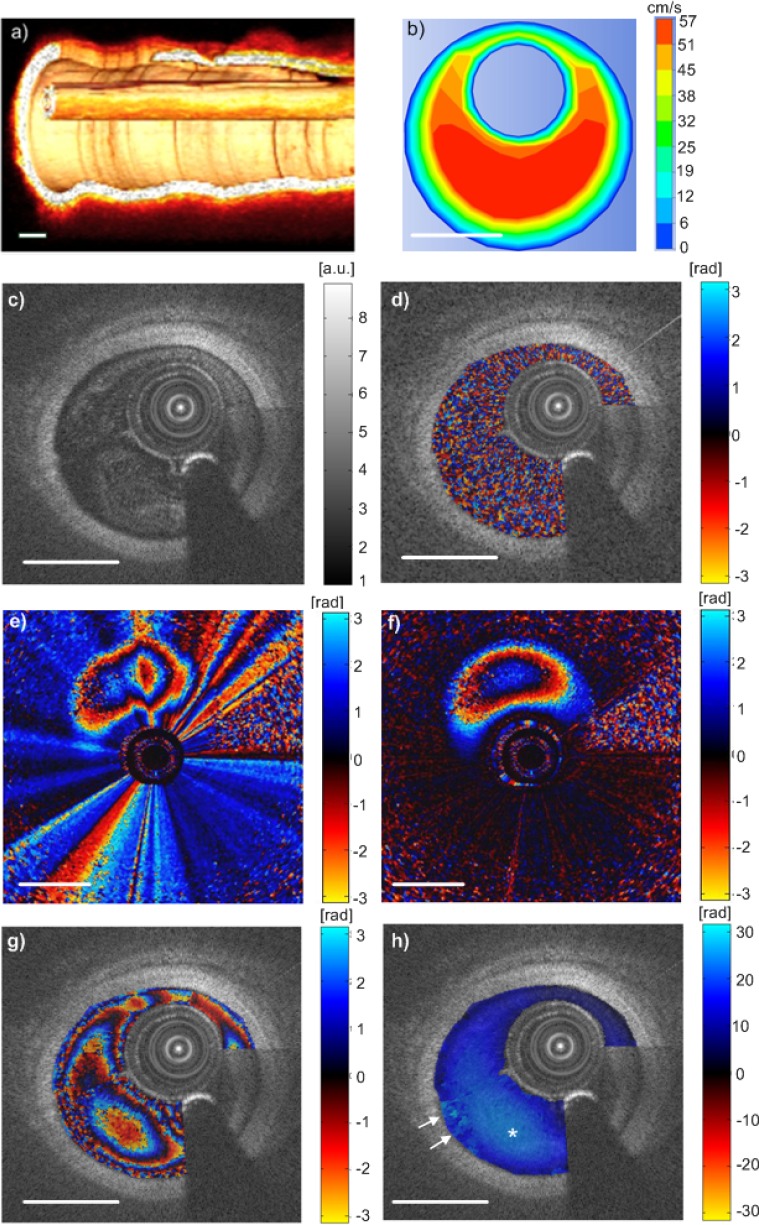
In vivo endovascular flow measurement. (a) 3D OCT image of the catheter and the vessel wall, which shows the angle between the catheter and the wall is ~10°. (b) Simulation results of blood flow. (c) Cross-sectional OCT image of a porcine carotid artery with shadow casted by guide wire. (d) The same cross-section as (c) imaged by 500 A-lines/frame with Doppler shift overlaid, showing mainly noise. (e) and (f) (Media 1 (4.7MB, AVI) ). (e) Phase shift image, 2500 A-lines/frame, without NURD induced phase artifact removal. It shows distorted phase contour lines. (f) Phase shift image after NURD induced phase artifact removal by tracking the phase shift in the catheter sheath. The corrected phase contour lines are as expected. The NURD induced artifact is time variant, as shown by Media 1 (4.7MB, AVI) . (g) A typical cross-sectional frame, 2500 A-lines/frame with Doppler shift overlaid, showing aliased phase changes. (h) The unwrapped phase map of (g), where * indicates the highest velocity region. The arrows indicate incorrect phase unwrapping due to noise and high shear rate near the vessel wall. Scale bars = 1 mm.

