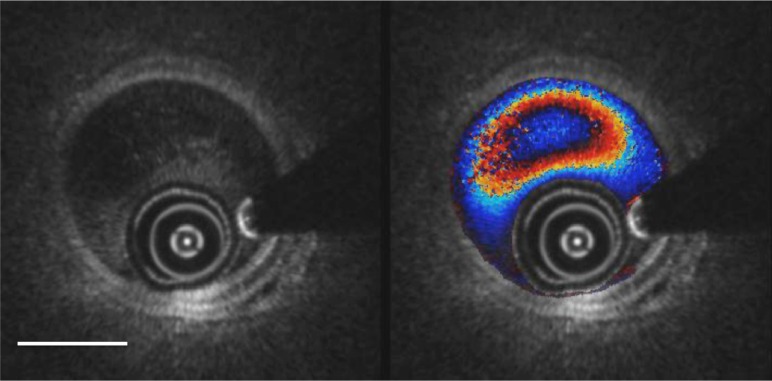
Fig. 6.
(Media 2 (1.2MB, AVI) ) Simultaneous structural (left) and Doppler overlay (right) OCT video images (Media 2 (1.2MB, AVI) ) over 2 seconds during the late phase of pump injection. Note the arterial pulsations in the structural images and the aliasing rings of the flow profile in the Doppler image. A seam line is moving through between the 11 o’clock and 2 o’clock positions, more apparent in the Doppler image than the structural. Scale bar = 1 mm.

