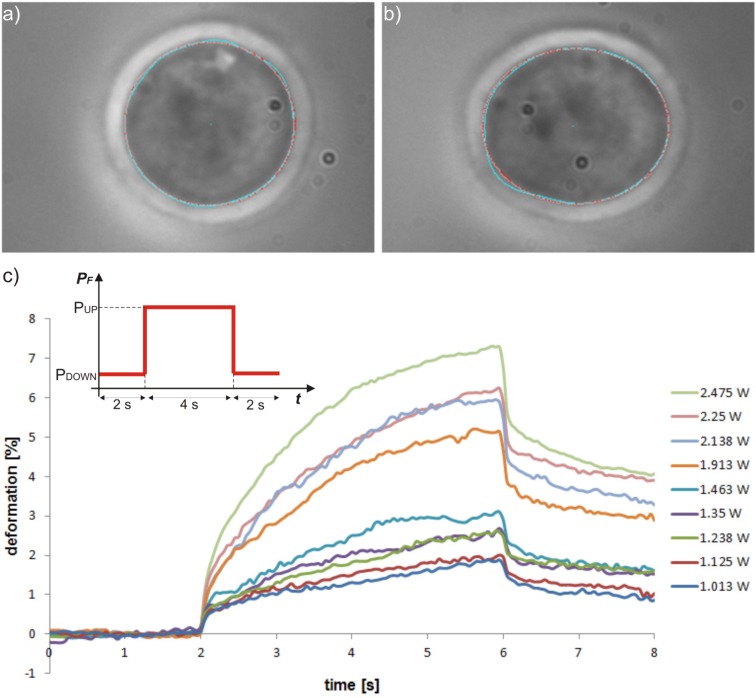
Fig. 5.
Phase contrast microscope images of (a) trapped and (b) stretched HL60 cell in a MOS stretching experiment with automatic contour recognition. (c) HL60 response to step-like increase in applied optical stress for different stretching power values. The inset represents the temporal shape of the step-like optical stimulus applied at the fibre output PF. The plot represents the average deformation of about 40–60 cells each as a function of time for different values of PUP of the step stimulus.

