Figure 5.
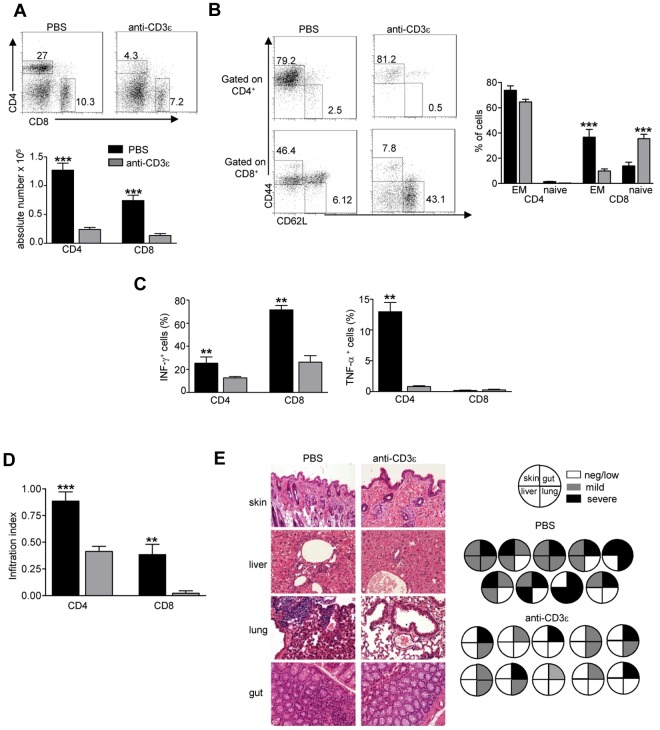
Anti-CD3ε mAb administration in RAG2R229Q newborns reduces activation of peripheral T cells and prevents immunopathology. (A top), Representative dot plots of CD4+ and CD8+ populations in LNs of PBS and anti-CD3ε mAb-treated RAG2R229Q mice; numbers represent the percentages of cells within the indicated regions. (Bottom) Absolute numbers of CD4+ and CD8+ cells in LNs of PBS (n = 12) and anti-CD3ε mAb (n = 21) RAG2R229Q mice; ***P < .0001. (B left), Representative dot plots with the distribution of naive and EM cells within CD4+ and CD8+ LNs cells in PBS and anti-CD3ε mAb RAG2R229Q mice. (Right) Statistics of the percentage of EM and naive cells in CD4+ and CD8+ subsets from PBS (n = 13) and anti-CD3ε mAb-treated mice (n = 21). (C) Graphic representation of the percentage of CD4+ and CD8+ cells producing the indicated cytokines obtained by intracellular staining in LNs from PBS and anti-CD3ε mAb RAG2R229Q mice (n = 5); **P = .0079. (D) Infiltration index of CD4+ and CD8+ cells (see “Analysis of the ratio between medullary and cortical area and tissue-infiltration score”) in several organs (liver, lung, skin, and gut) of mice treated with PBS (n = 10) and anti-CD3ε mAb (n = 11); ***P = .0006, **P = .0034. (E left) Representative H&E staining of skin, lung, liver, and gut from PBS and anti-CD3ε–treated mice (original magnification, ×20). (Right) Pie charts show global infiltration grade in each organ calculated from H&E staining as described in “Analysis of the ratio between medullary and cortical area and tissue-infiltration score.” Each pie represents a mouse from 1 of the 2 groups.

