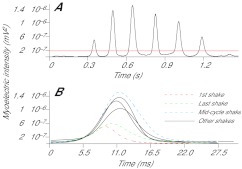
Fig. 3.
(A) Example of total myoelectric intensity as a function of time (black line) from the lateral gastrocnemius muscle of subject 2 during a paw-shake response. The red horizontal line represents the threshold value used to split the paw-shake event into individual cycles. (B) Individual cycles from the example intensity plot, with those used for analysis indicated: first shake, mid-cycle shake and last shake (see key). All other shakes are shown by black solid lines.

