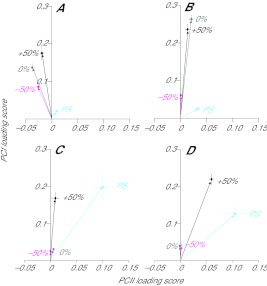
Fig. 5.
PCI–PCII loading score plots from whole-stride and paw-shake data collected from (A) soleus, (B) plantaris, (C) medial gastrocnemius and (D) lateral gastrocnemius. Each point represents the mean ± s.e.m. loading score value for each condition: level walking (0%, grey), downslope walking (−50%, pink), upslope walking (+50%, black) and paw-shake (PS, blue).

