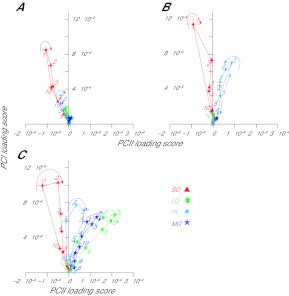
Fig. 6.
PCI–PCII loading score vector plots for soleus, plantaris, medial gastrocnemius and lateral gastrocnemius from partitioned strides during walking on (A) −50% slope, (B) 0% slope and (C) +50% slope. Each point with a number represents one of 10 equal time windows into which the strides were partitioned. Arrows indicate the direction of the loops, and numbers indicate the 10% cycle time windows, with number 1 indicating the beginning of stance and number 10 indicating the end of swing. PCI loading scores correlate highly with myoelectric intensity; the angle between each PCI–PCII loading score vector and the PCII loading score axis (θ) represents the relative frequency content of the signal (see Fig. 2).

