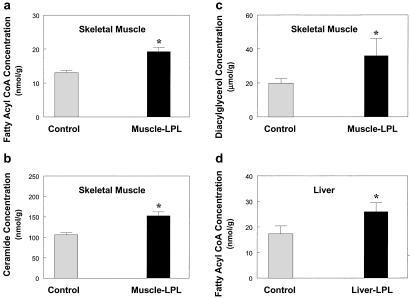
Figure 8.
Intracellular fatty acid-derived metabolites in the skeletal muscle and liver. (a) Intracellular fatty acyl CoA concentration in skeletal muscle in the control (open bars) and muscle-LPL (filled bars) groups. (b) Intracellular ceramide concentration in skeletal muscle in the control (open bars) and muscle-LPL (filled bars) groups. (c) Intracellular diacylglycerol concentration in skeletal muscle in the control (open bars) and muscle-LPL (filled bars) groups. (d) Intracellular fatty acyl CoA concentration in liver in the control (open bars) and liver-LPL (filled bars) groups. Values are means ± SE for 5≈10 experiments. *, P < 0.05 vs. control group.

