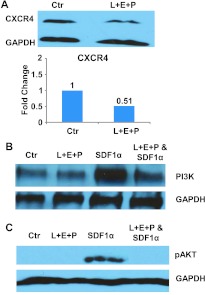
Figure 7.
Effect of L + E + P on the SDF1α chemotaxis in prostate cancer cells. (A) Immunoblot analysis for CXCR4 in extracts prepared from PC3 cells treated with L + E + P at 8 µg/ml for 24 hours. (B) PI3K immunoblot analysis with protein extract from PC3 cells treated with 200 ng/ml SDF1α for 8 hours in the presence of L + E + P at 8 µg/ml. (C) Phosphor-Akt immunoblot analysis with protein extract from PC3 cells induced with 200 ng/ml SDF1α for 2 minutes in the presence of L + E + P at 8 µg/ml.

