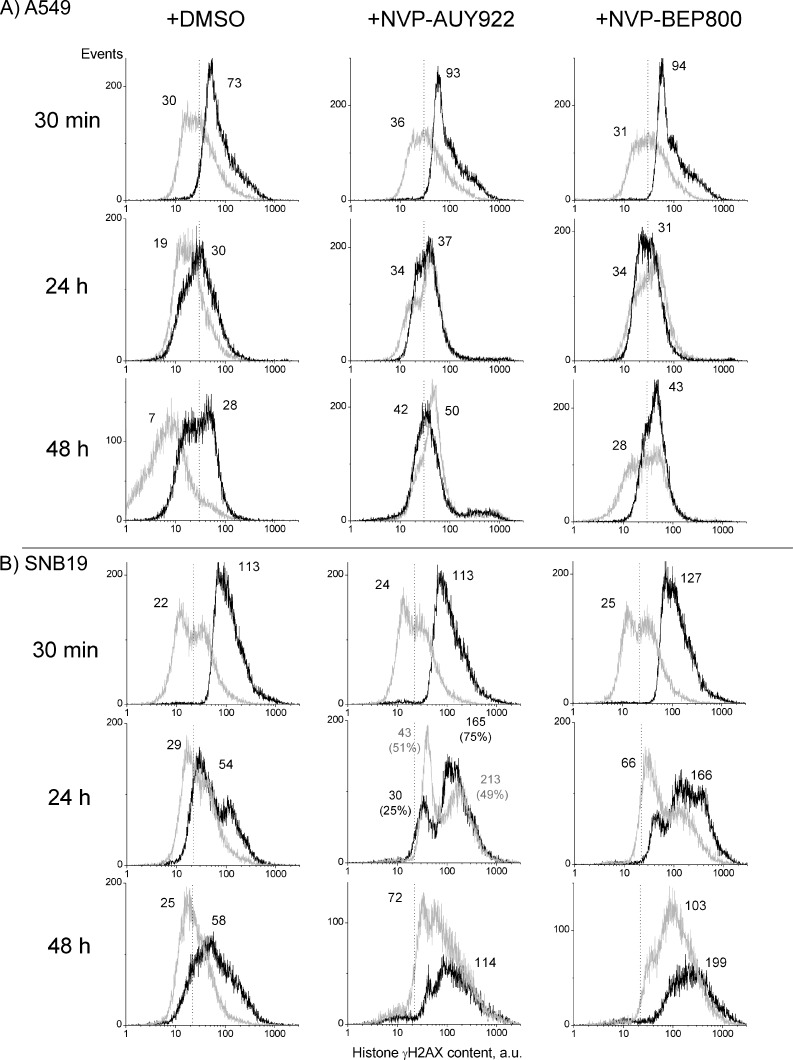
Figure 3.
Typical distributions of histone γH2AX, as a marker of DNA DSBs, in A549 (A) and SNB19 (B) cell lines. Black and light gray histograms represent irradiated (8 Gy) and nonirradiated cells, respectively. Numbers denote the mean γH2AX expression for the respective cell subpopulation and the percentage of cells in the subpopulation. To facilitate visual comparison, the modal γH2AX values of DMSO-treated and irradiated samples are indicated by dashed vertical lines. The experiment was repeated at least three times.

