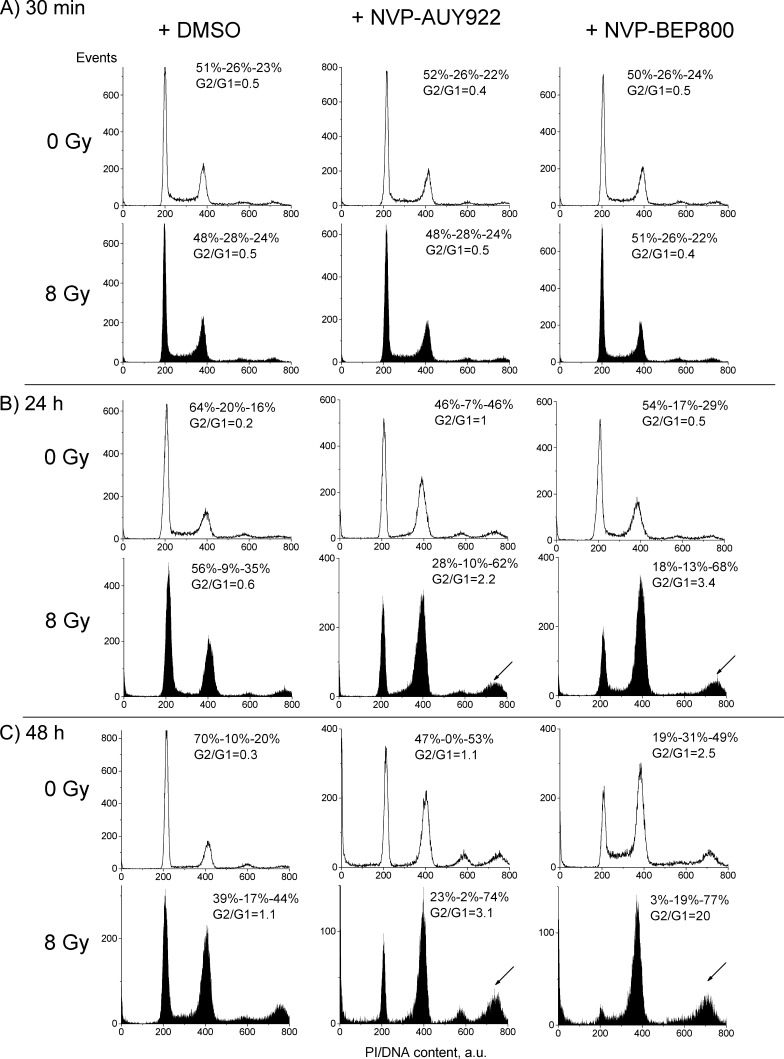
Figure 4.
Impact of Hsp90 inhibitors, IR, and combined drug-IR treatment on the cell cycle-phase distribution in the SNB19 cell line 30 minutes (A), 24 hours (B), 48 hours (C) after drug and/or IR treatments (8 Gy). Numbers denoted the percentage of cells in G1, S, and G2/M phases and G2/G1 ratios in each cell sample. Filled and unfilled histograms represent irradiated and nonirradiated cells, respectively. Measurements of cell cycle progression were repeated at least three times.

