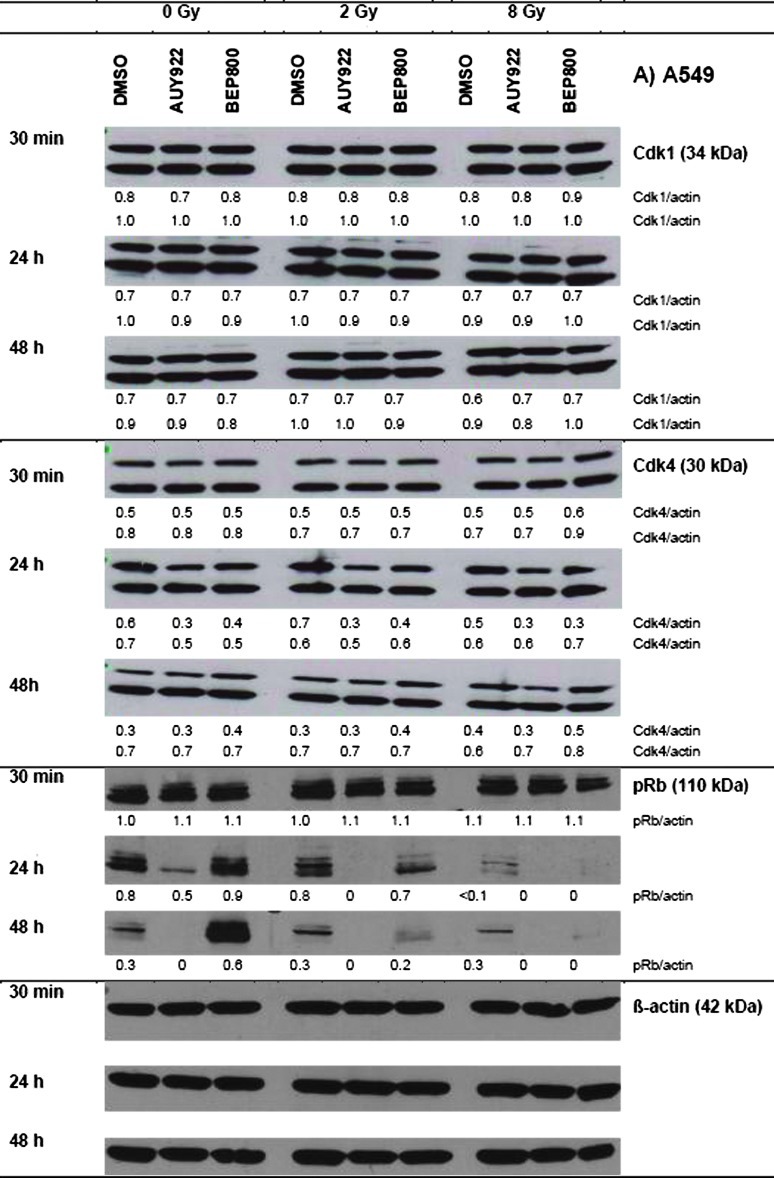
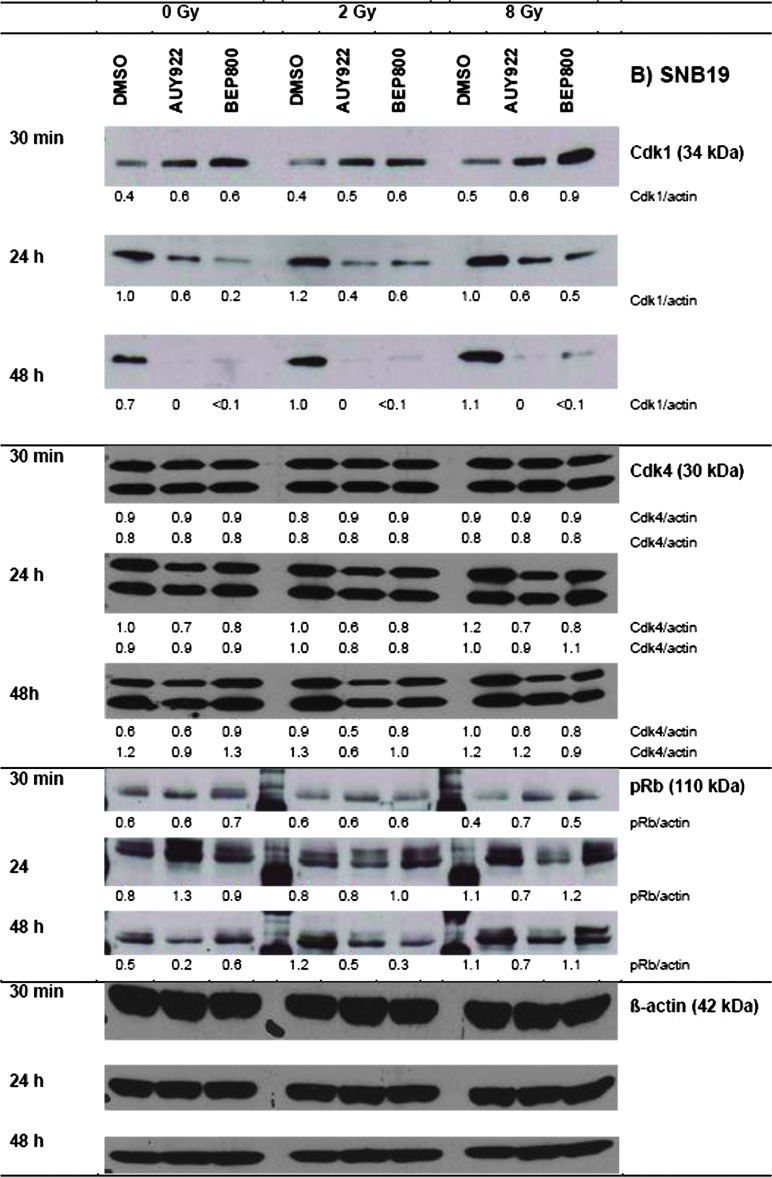
Figure 5.
Effects of Hsp90 inhibitors on the expression levels of cell cycle regulatory proteins in the A549 (A) and SNB19 (B) tumor cell lines. In case of Cdk1 and Cdk4, which exhibited double isoform bands, the protein/actin ratios are given for both isoforms. Each protein band was normalized to the intensity of β-actin used as loading control, and the ratios are given by numbers. The experiment was repeated three times.


