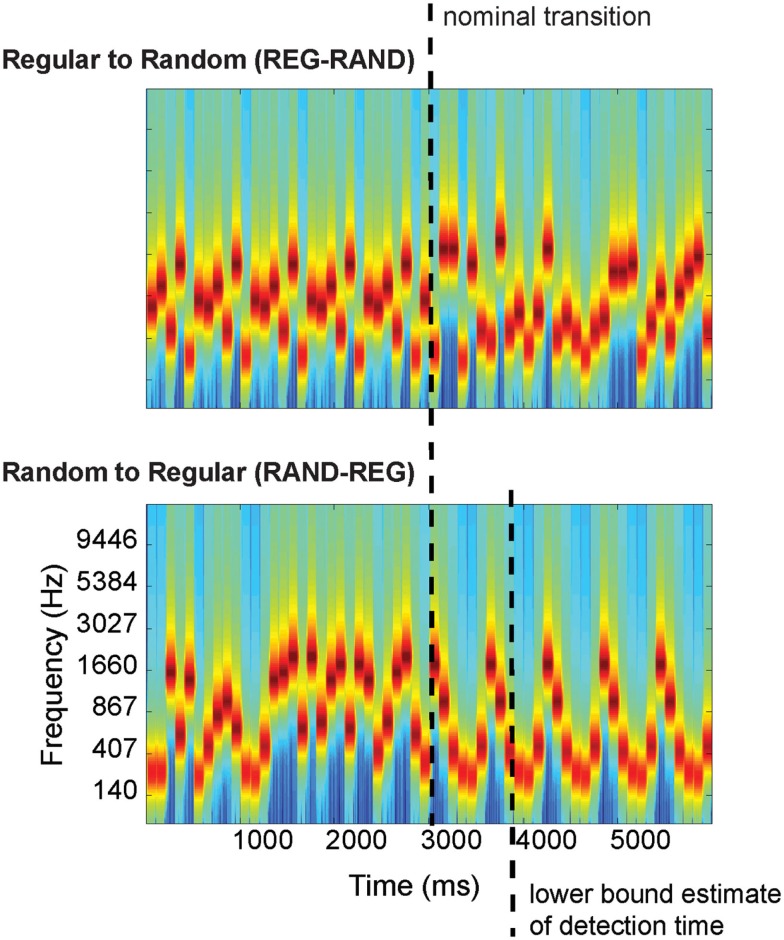
Figure 1.
Examples of the auditory stimuli. Top: transition between a regular and random frequency pattern (REG-RAND). Bottom: transition between a random to regular frequency pattern (RAND-REG). The nominal transition, and lower bound estimate of detection time (for RAND-REG; derived in the DETECT block) are indicated with dashed lines. The plots represent “auditory” spectrograms, generated with a filterbank of 1/ERB wide channels (Equivalent Rectangular Bandwidth; Moore and Glasberg, 1983) equally spaced on a scale of ERB-rate. Channels are smoothed to obtain a temporal resolution similar to the Equivalent Rectangular Duration (Plack and Moore, 1990).

