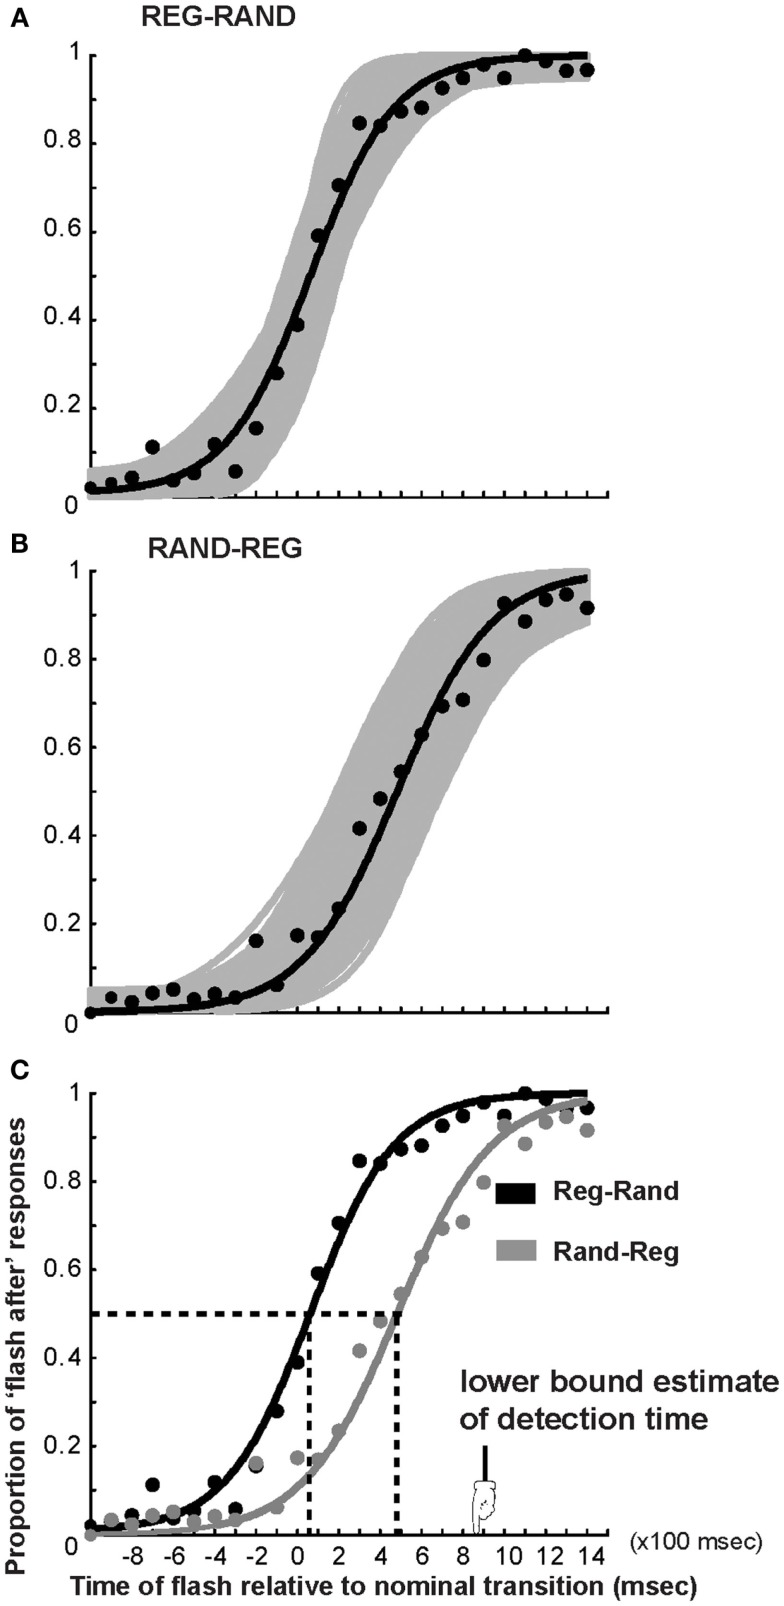
Figure 2.
Psychometric fits to the TOJ data in Experiment 1. The x-axis represents the timing of the light flash with respect to the acoustic transition (measured in number of tone pips, multiply by 100 to obtain milliseconds). Negative numbers indicate flash before nominal transition. (A) Proportion of “light flash after” responses for the REG-RAND stimulus averaged over subjects (black circles) and cumulative Gaussian fit (black curve). The gray curves are fits computed over 1000 bootstrap resamplings; their scatter provides a measure of variability across subjects. (B) Same for the RAND-REG transition. (C) Comparison of REG-RAND and RAND-REG psychometric functions. The vertical dashed lines indicate the PSS.

