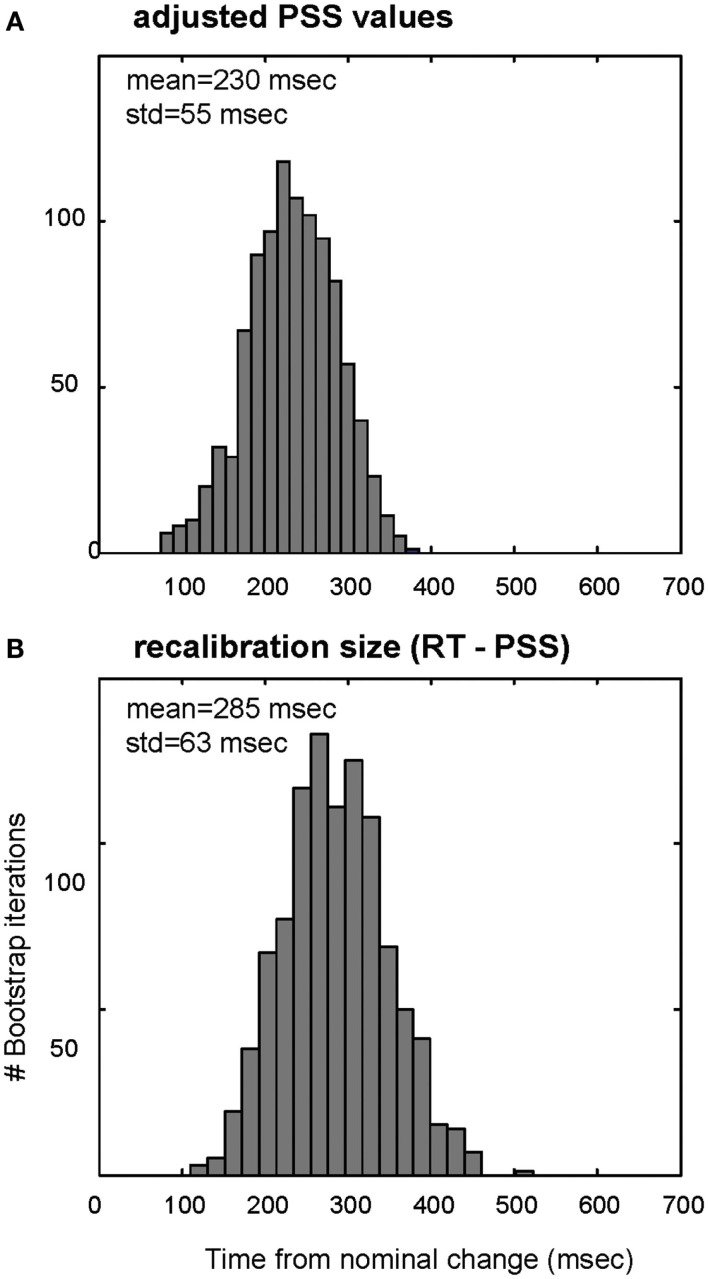
Figure 5.
Distributions of RAND-REG adjusted PSS values (A) and recalibration size (B) in Experiment 2 as computed with bootstrap resampling. (A) Gray bars: histogram of average PSS values obtained with a “repeated measures” bootstrap procedure, by which we repeatedly select with replacement a set of 15 subjects, estimate each individual PSS (including correction of RAND-REG PSS by the PSS of REG-RAND), compute the average over the group, and increment the appropriate histogram bin. (B) Same for recalibration size (RT-PSS).

