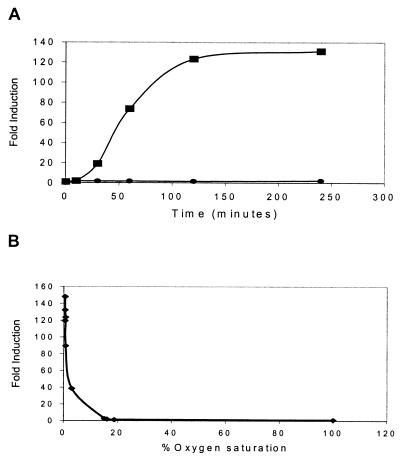
Figure 1.
Acr responds rapidly to reduced O2 tension. (A) Time course of acr induction, performed as described in the text. At the indicated times, individual sealed tubes were removed and assayed for lux activity in duplicate. Shown are representative data from one experiment of five. Squares represent BCG:acr-lux in sealed tubes flushed with 0.2% O2 in N2. Circles represent BCG:acr-lux treated identically, except the tubes were not sealed. (B) Induction of acr as a function of dissolved O2 concentration, performed as described in the text. Shown are representative data from one experiment of two.

