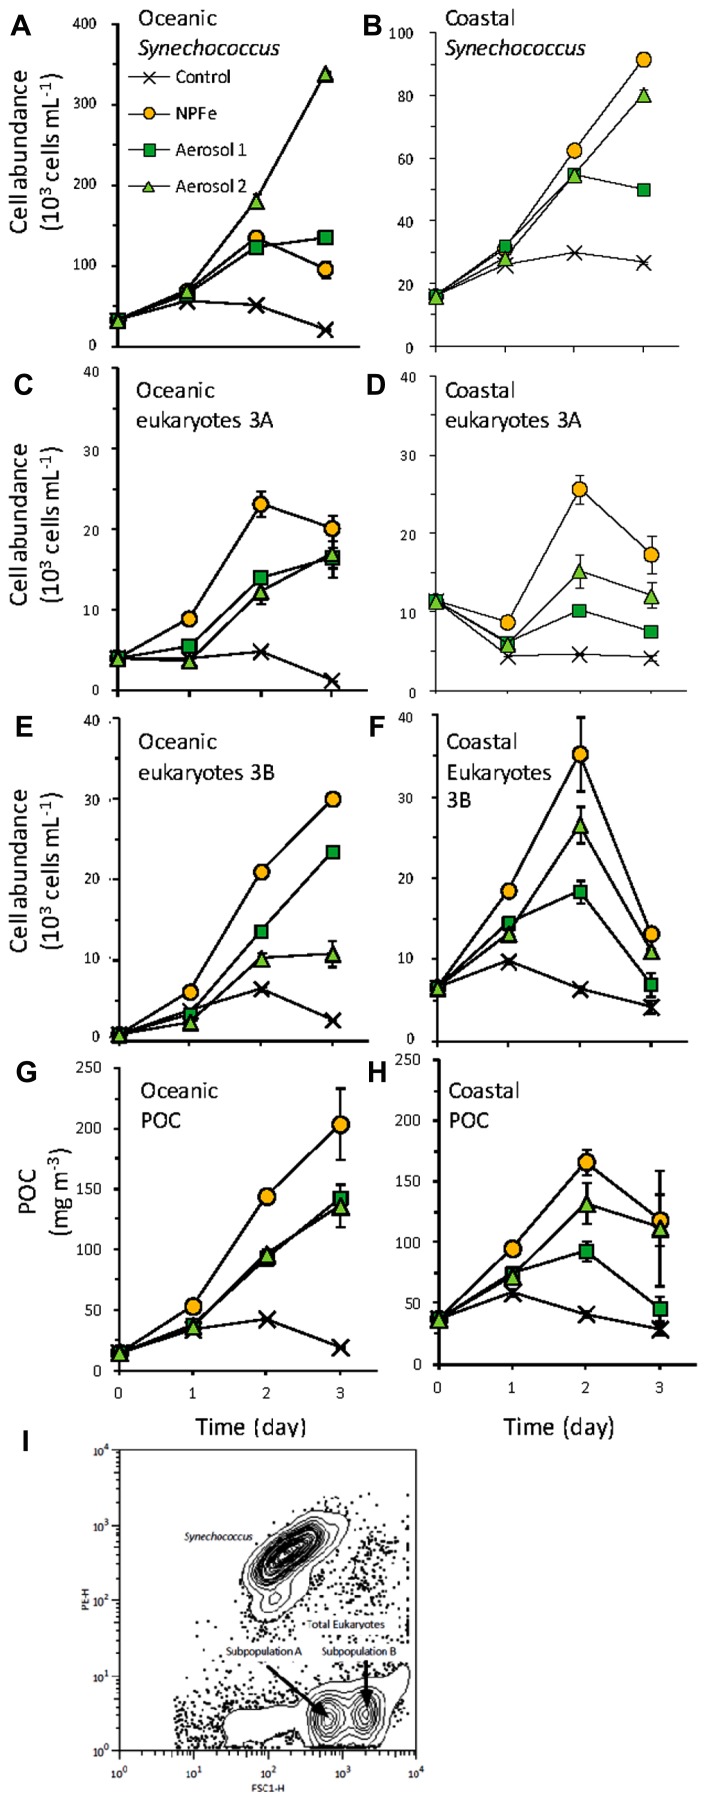
FIGURE 4.
Cell growth for (A,B) Synechococcus(C,D) picoeukaryote subpopulation 3A, and (E,F) picoeukaryote subpopulation 3A during the oceanic (A,C,E) and coastal (B,D,F) experiments. (G,H) Total particulate C concentration contributed from Synechococcus and picoeukaryotes in the (E) oceanic, and (F) coastal experiments. Error bars show standard error for triplicate bottles. (I) Distributions of Synechococcus and picoeukaryote subpopulations based on forward scatter (FSC-H) and orange fluorescence (PE-H).

