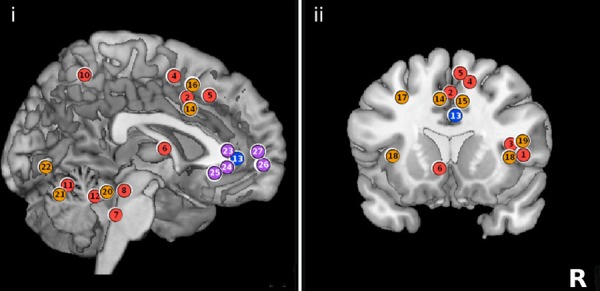
Figure 1b. Summary schematic of regional brain activity registered by functional magnetic resonance imaging (fMRI) during bladder filling experiments.

(i). Sagittal section of the brain. (ii). Coronal section of the brain. Numerals 1–27 indicate areas previously published by authors Tadic and Griffiths. Color-coded circles show activation (red/orange) and deactivation (blue/purple) and are placed in approximate locations for schematic purposes. All figures are shown in neurological convention (right side on right). (With permission from Journal of Urology [16])
