Figure 1.
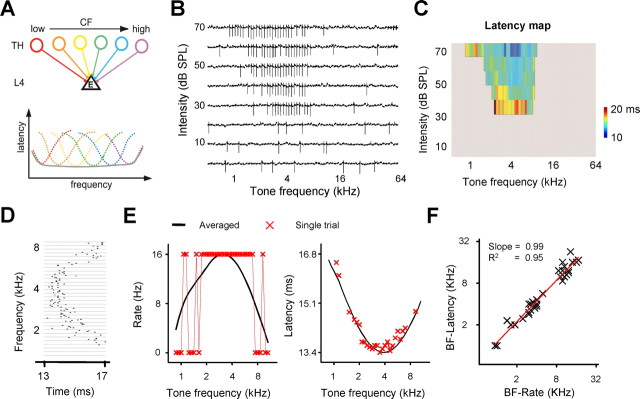
Frequency tuning of spike rate and first spike latency in layer 4 pyramidal neurons of the rat A1. A, A schematic demonstration of a potential degradation of latency tuning when multiple thalamic inputs with diverse CFs converge onto a layer 4 (L4) neuron. Bottom, Each colored dashed curve represents spike latency tuning of the corresponding thalamic neuron. The solid gray curve represents the latency tuning of the summed input. B, Tone-evoked spike responses in an example neuron examined by the cell-attached recording. Each small trace (100 ms) represents the recorded trace to a tone of a particular frequency and intensity. Vertical deflections are spikes. C, Color map of the cell's first spike latency within the frequency-intensity space. The space outside the determined tonal receptive field is colored with gray. D, Raster plot of spike timing for the responses at 60 dB intensity. For each testing frequency, five trials are presented. E, The frequency tuning curve of average responses (solid black) and that of responses in a single trial (no spike or 1 spike within a 62.5 ms analysis window; crosses). Left, Spike rate. Right, Spike latency. F, BF determined by spike rate tuning versus that by spike latency tuning. Each symbol represents data from the same cell (n = 34 cells). The red line is the best-fit linear regression line.

