
Figure 5.
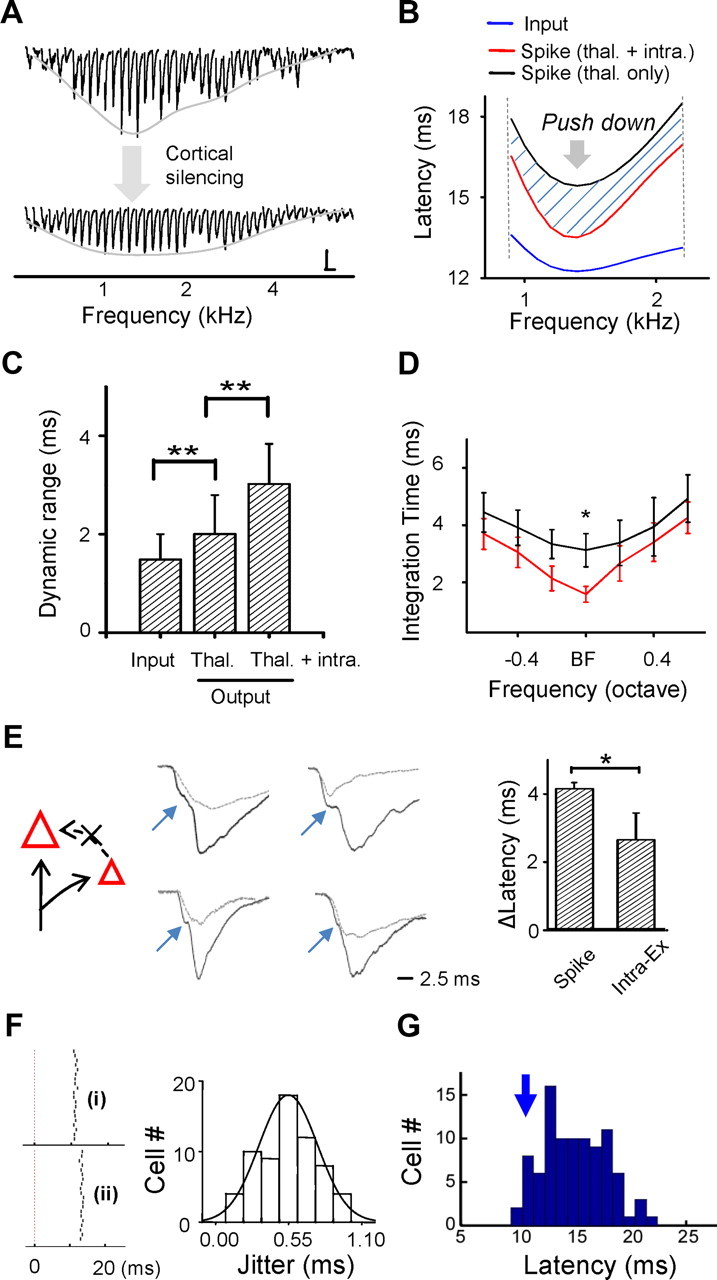
Contribution of thalamocortical and intracortical excitatory inputs to spike latency tuning. A, Excitatory responses to 70 dB tones of various frequencies before and after cortical silencing in an example neuron. The gray curve depicts the tuning curve of synaptic strength. Calibration: 100 pA, 100 ms. B, Smoothed tuning curves of thalamocortical input latency (blue) and spike latency derived from the thalamocortical input alone (black) and that from the total excitatory input (red) within the estimated spiking frequency range. C, Average dynamic range of input latency and of spike latency based on the thalamocortical input only and that based on the total excitatory input. D, Average tuning curves of integration time derived from the total excitatory input (red) and from the thalamocortical input only (black). Whiskers indicate SE. E, Left, Schematic drawing shows that input from other cortical excitatory neurons (represented by the smaller triangle) is eliminated after cortical silencing. Middle, Average excitatory responses to BF tones before (black) and after (gray) cortical silencing in four example cells. Blue arrow points to the “kink” in the response trace before cortical silencing, which indicates the arrival of a fast intracortical excitatory input. Right, Latency of the first spike and of the second excitatory component relative to the onset of excitation. Error bars indicate SD. *p < 0.01; **p < 0.001 (paired t test, n = 10). F, Left, Raster plot of spike time in response to repeated 70 dB BF tones (20 trials) for two example cells. Right, Distribution of jitters of first spike latency for neurons tested. G, Distribution of first spike latencies within 93 neurons recorded in the middle layers with cell-attached recordings.