
Figure 5. Cdk2/cyclin A inhibition curves for the p27-KID variants.
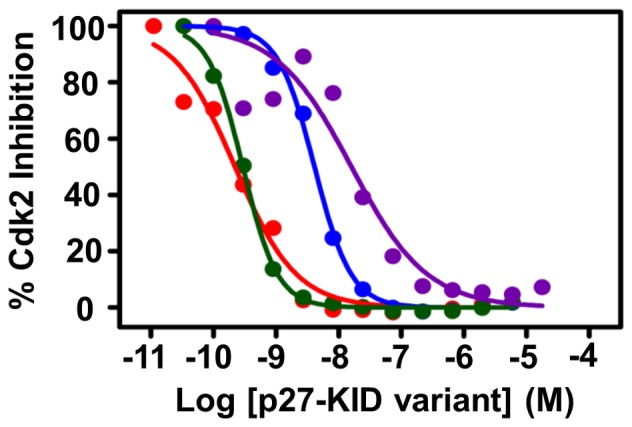
The curves for p27-KIDwt, p27-KID+H, p27-KID−H, and p27-KIDloop are colored red, blue, green, and purple, respectively.
Official websites use .gov
A
.gov website belongs to an official
government organization in the United States.
Secure .gov websites use HTTPS
A lock (
) or https:// means you've safely
connected to the .gov website. Share sensitive
information only on official, secure websites.
The curves for p27-KIDwt, p27-KID+H, p27-KID−H, and p27-KIDloop are colored red, blue, green, and purple, respectively.